Android vs. Apple Market Share: Leading Mobile Operating Systems (OS) (2025)


Did you know that Google’s Android is the most popular mobile operating system around the globe? Apple’s iOS, however, reigns supreme in the United States. Android takes the top spot at 69.88% market share globally in 2024, beating iOS by a 40% difference, which has a 29.39% market share. Meanwhile, in the US, Apple continues to dominate at 61.45% market share, beating Android by a 23% difference.
Let’s delve into the market share of our devices’ two major operating systems – iOS, which powers iPhones, and Android, which powers many phones manufactured by many companies.
| Operating System | Quarterly Market Share (%) |
|---|---|
| Android | 69.88 |
| iOS | 29.39 |
| Samsung | 0.36 |
| KaiOS | 0.16 |
| Windows | 0.02 |
| Others | 0.19 |
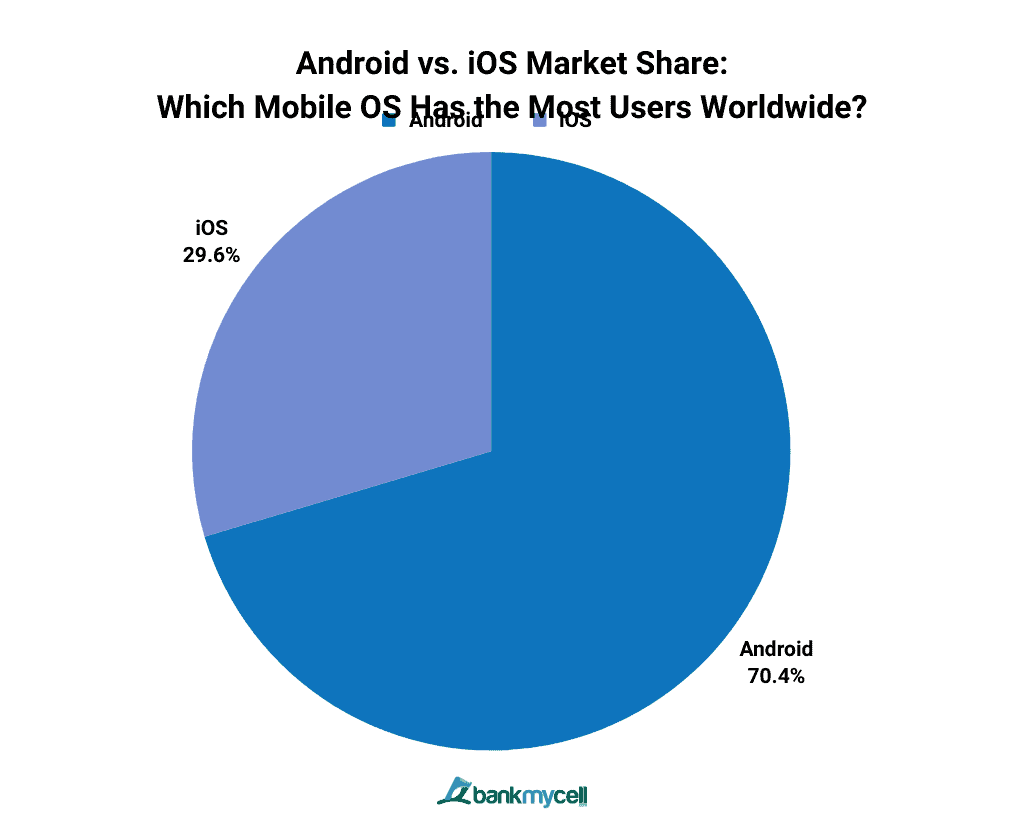
In the most recent quarter of 2024, Android remained the most popular operating system in the world, with a 69.88% market share, followed by its main competitor, iOS, with 29.39%. Both operating systems make up more than 99% of the market share for operating systems worldwide
Editors Picks:
- Mobile OS Quarterly Market Share Worldwide: Android continues to reign in the operating system market worldwide, with a 69.88% market share in 2024’s most recent quarter. Apple’s iOS takes the second largest market share at 29.39% market share. It follows behind Android with a huge 40% difference.
- Mobile OS Yearly Market Share Worldwide: Android’s 2023 yearly market share worldwide at 69.88% is a 0.38% decline compared to 2023. Apple’s iOS came second at 29.39%, an increase of 0.37% from the previous year.
- Mobile OS Quarterly Market Share in the US: In the US, iOS led with a 61.45% market share in the most recent quarter of 2024, while Android generated a 38.13% market share, a difference of 23.32%.
- Mobile OS Yearly Market Share in the US: The yearly market share of iOS in the US in 2024 is at 61.45%, an increase of 3.35% from 2023. Android doesn’t fall too far behind with a 38.13% market share, a decline of 3.33% from the last year.
Android vs. iOS Market Share
Which Mobile OS Has the Most Users Worldwide?
| Operating System | Quarterly Market Share (%) |
|---|---|
| Android | 69.88 |
| iOS | 29.39 |
- Data Table
-
Operating System Quarterly Market Share (%) Android 69.88 iOS 29.39 - Data Graphic
-

Android continues to reign in the global market with a 69.88% market share in the most recent quarter of 2024, while iOS has 29.39% of the mobile operating system users.
Android is an open-source platform owned by Google that can be adapted and used by many smartphone brands. It is one of the reasons why Android rules the mobile operating system market. Meanwhile, iOS is developed for Apple products only.
Android vs. iPhone Market Share Worldwide (2009-2024)
| Year | Android (%) | iOS (%) |
|---|---|---|
| 2024 | 69.88 | 29.39 |
| 2023 | 70.26 | 29.02 |
| 2022 | 71.47 | 27.85 |
| 2021 | 71.89 | 27.34 |
| 2020 | 73.06 | 26.28 |
| 2019 | 75.47 | 22.71 |
| 2018 | 75.45 | 20.47 |
| 2017 | 72.63 | 19.65 |
| 2016 | 69.11 | 19.29 |
| 2015 | 64.2 | 20.2 |
| 2014 | 53.65 | 23.95 |
| 2013 | 39.21 | 24.03 |
| 2012 | 27.41 | 24.04 |
| 2011 | 19 | 22.29 |
| 2010 | 8.82 | 25.48 |
| 2009 | 2.41 | 34.01 |
- Data Table
-
Year Android (%) iOS (%) 2024 69.88 29.39 2023 70.26 29.02 2022 71.47 27.85 2021 71.89 27.34 2020 73.06 26.28 2019 75.47 22.71 2018 75.45 20.47 2017 72.63 19.65 2016 69.11 19.29 2015 64.2 20.2 2014 53.65 23.95 2013 39.21 24.03 2012 27.41 24.04 2011 19 22.29 2010 8.82 25.48 2009 2.41 34.01 - Data Graphic
-

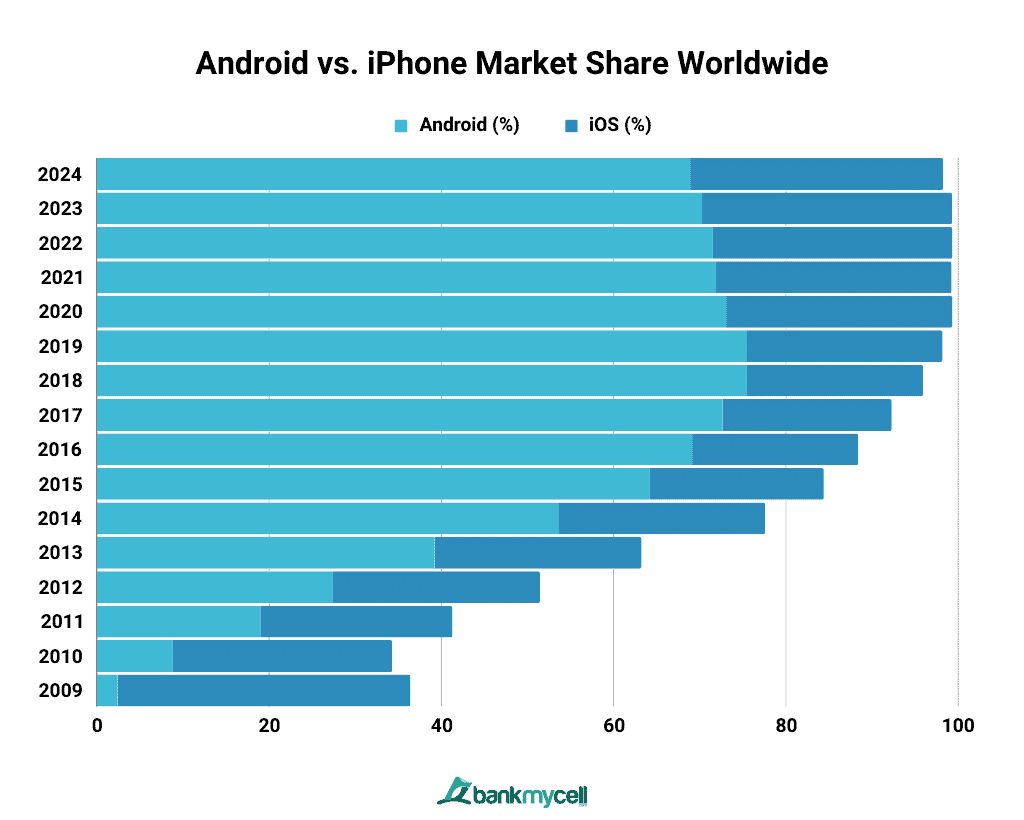
In the year 2024, Android maintained its lead in operating system market share at 69.88%, followed by Apple at 29.39%. Android started its top position in the global market in 2012, beating iOS by 3.37%. It has continued to dominate the mobile operating system market ever since. From 2009 to present, Android grew by more than 67%, while iOS’s market share has shown a decline of around 5%.
Market Share of Apple vs. Android in the US
Why Does iOS Rule in the US?
| Operating System | Quarterly Market Share (%) |
|---|---|
| iOS | 61.45 |
| Android | 38.13 |
- Data Table
-
Operating System Quarterly Market Share (%) iOS 61.45 Android 38.13 - Data Graphic
-

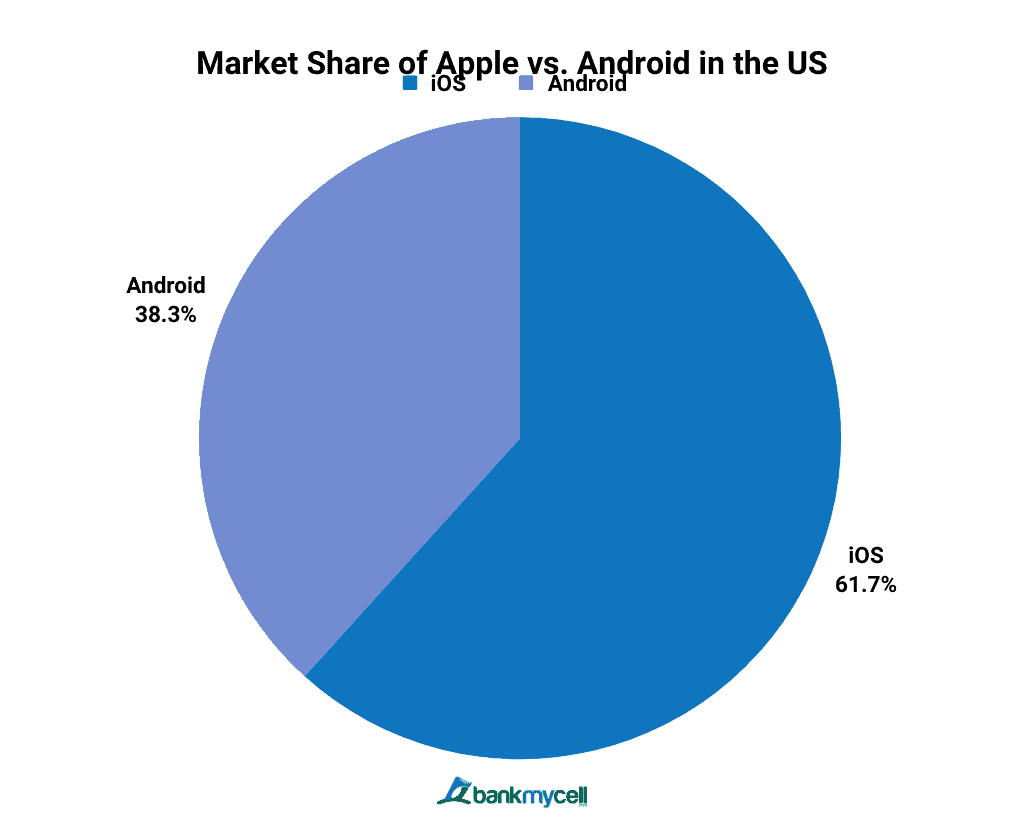
The major mobile operating systems in the US are Apple’s iOS and Google’s Android. In the most recent quarter of 2024, iOS leads with a quarterly market share of 61.45% market share, while Android took 38.13%, a significant gap of 23%.
Financial Times reported that a strong trend of Android users migrating to iOS gives Apple an edge to rule the smartphone market in the US. The active installed base, which is the number of smartphones in use, also accounts for the large market share of Apple in the country.
iOS vs. Android Market Share in the US (2009-2024)
| Year | iOS (%) | Android (%) |
|---|---|---|
| 2024 | 61.45 | 38.13 |
| 2023 | 58.1 | 41.46 |
| 2022 | 56.74 | 42.94 |
| 2021 | 58.58 | 41.11 |
| 2020 | 59.54 | 40.27 |
| 2019 | 55.23 | 44.51 |
| 2018 | 54.82 | 44.73 |
| 2017 | 53.89 | 45.23 |
| 2016 | 53.19 | 45.2 |
| 2015 | 50.85 | 46.42 |
| 2014 | 52.3 | 42.58 |
| 2013 | 52.79 | 39.25 |
| 2012 | 49.48 | 40.63 |
| 2011 | 38.33 | 35.32 |
| 2010 | 38.31 | 18.71 |
| 2009 | 57.9 | 6.16 |
- Data Table
-
Year iOS (%) Android (%) 2024 61.45 38.13 2023 58.1 41.46 2022 56.74 42.94 2021 58.58 41.11 2020 59.54 40.27 2019 55.23 44.51 2018 54.82 44.73 2017 53.89 45.23 2016 53.19 45.2 2015 50.85 46.42 2014 52.3 42.58 2013 52.79 39.25 2012 49.48 40.63 2011 38.33 35.32 2010 38.31 18.71 2009 57.9 6.16 - Data Graphic
-

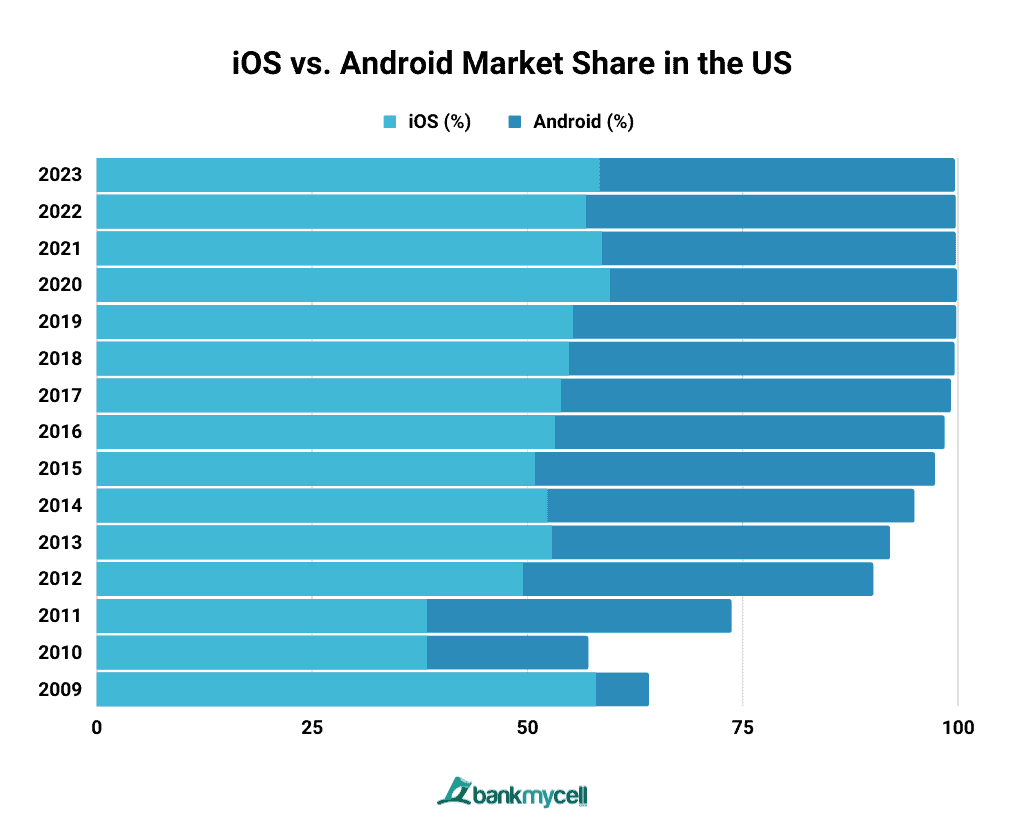
The current yearly market share of iOS in the US is 61.45%, followed by Android with 38.13%. iOS has dominated the US smartphone operating system market since 2009 up until the present. Despite dominating the operating system market share worldwide, Android only came second to Apple in the US. Android came close in 2015 with only a 3.01% difference, but the gap widened again over the years.
Android Market Share
The Leading Mobile Operating System Worldwide
In 2024, Android dominated the mobile OS market share in the world with 69.88% market share, ahead by 40% compared to its competitor, Apple’s iOS. The Google Play Store, where Android users can download and purchase apps, generated US $42.3 billion in 2022, a decline of 11.69% from the previous year.
Who Owns Android?
Google LLC, the search engine company in America, acquired Android from its developer Android Inc. in 2005. Initially developed for digital cameras, Android is now an operating system for smartphones, tablets, and many more devices.
Which Mobile Brands Carry Android?
- Samsung
- Xiaomi
- Oppo
- Vivo
- Huawei
- Realme
- Motorola
And more…
With a $261 average selling price (ASP) in 2021, mobile brands that carry Android sell their smartphones to consumers cheaper than Apple, one of the significant reasons Android dominates in the smartphone market worldwide.
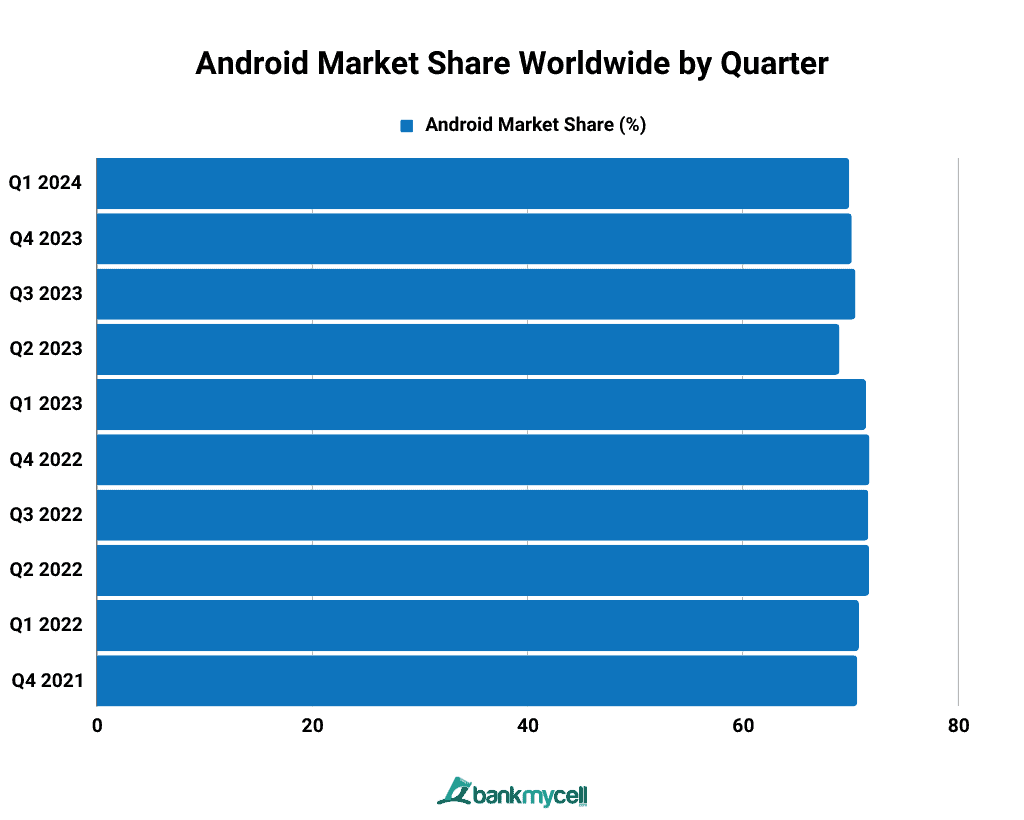
Android Market Share Worldwide by Quarter
| Quarter | Android Market Share (%) |
|---|---|
| Q1 2024 | 69.88 |
| Q4 2023 | 70.11 |
| Q3 2023 | 70.46 |
| Q2 2023 | 68.96 |
| Q1 2023 | 71.44 |
| Q4 2022 | 71.75 |
| Q3 2022 | 71.64 |
| Q2 2022 | 71.72 |
| Q1 2022 | 70.78 |
| Q4 2021 | 70.62 |
- Data Table
-
Quarter Android Market Share (%) Q1 2024 69.88 Q4 2023 70.11 Q3 2023 70.46 Q2 2023 68.96 Q1 2023 71.44 Q4 2022 71.75 Q3 2022 71.64 Q2 2022 71.72 Q1 2022 70.78 Q4 2021 70.62 - Data Graphic
-

Android remained the top mobile operating system globally in 2024, with a 69.88% market share. It is currently ahead of iOS by around 40%. Compared to its market share in the fourth quarter of 2023, Android declined by 0.23%. It was mostly consistent in the last six quarters, with its market share around 70%.
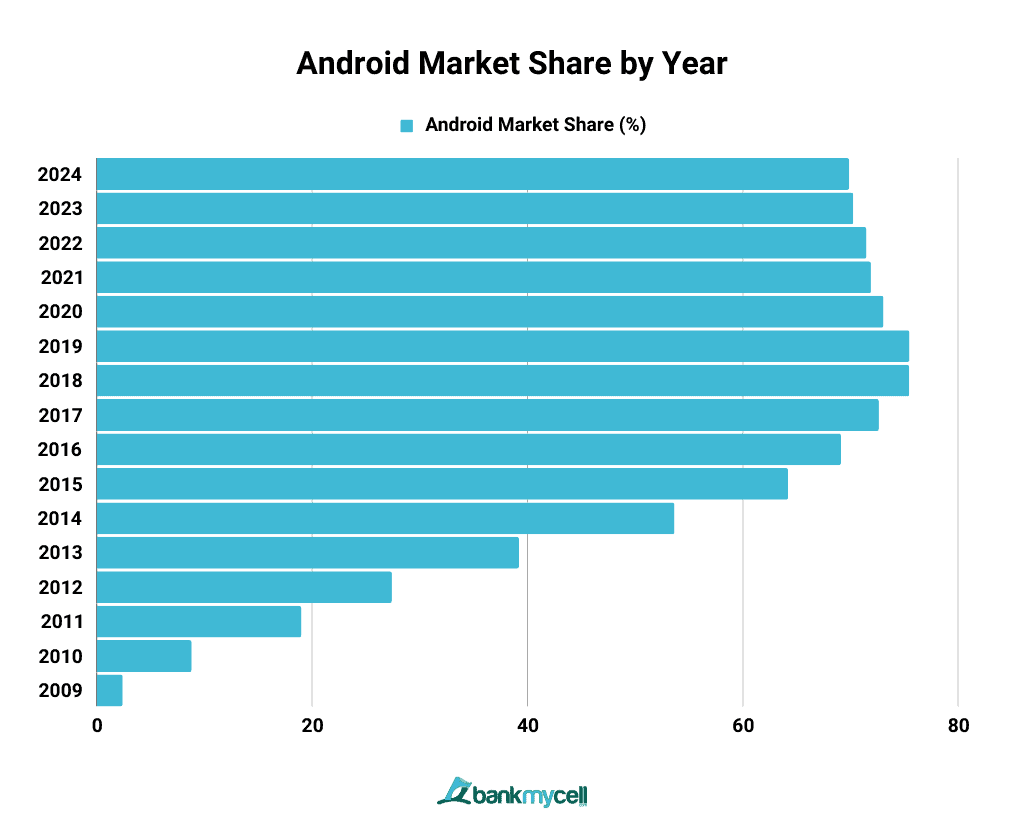
Android Market Share by Year (2009-2024)
| Year | Android Market Share (%) |
|---|---|
| 2024 | 69.88 |
| 2023 | 70.26 |
| 2022 | 71.47 |
| 2021 | 71.89 |
| 2020 | 73.06 |
| 2019 | 75.47 |
| 2018 | 75.45 |
| 2017 | 72.63 |
| 2016 | 69.11 |
| 2015 | 64.2 |
| 2014 | 53.65 |
| 2013 | 39.21 |
| 2012 | 27.41 |
| 2011 | 19 |
| 2010 | 8.82 |
| 2009 | 2.41 |
- Data Table
-
Year Android Market Share (%) 2024 69.88 2023 70.26 2022 71.47 2021 71.89 2020 73.06 2019 75.47 2018 75.45 2017 72.63 2016 69.11 2015 64.2 2014 53.65 2013 39.21 2012 27.41 2011 19 2010 8.82 2009 2.41 - Data Graphic
-

Android’s yearly market share in 2024 is at 69.88%, a slight decline of 0.38% from 2023. Google’s Android has maintained its high market share for operating systems worldwide over the years. It has consistently taken at least 70% market share since 2017 up to the present.
In 2019, it generated its highest-ever market share, with a 75.47% brand share. Around 1.3 billion Android devices were shipped that year. In 2021, 83.32% of mobile devices sold had the Android operating system installed.
Android Market Share in the US
In the most recent quarter of 2024, Google’s Android operating system generated a 38.13% market share in the US, coming in second and around 23% behind iOS. These mobile operating systems are the main competitors in America.
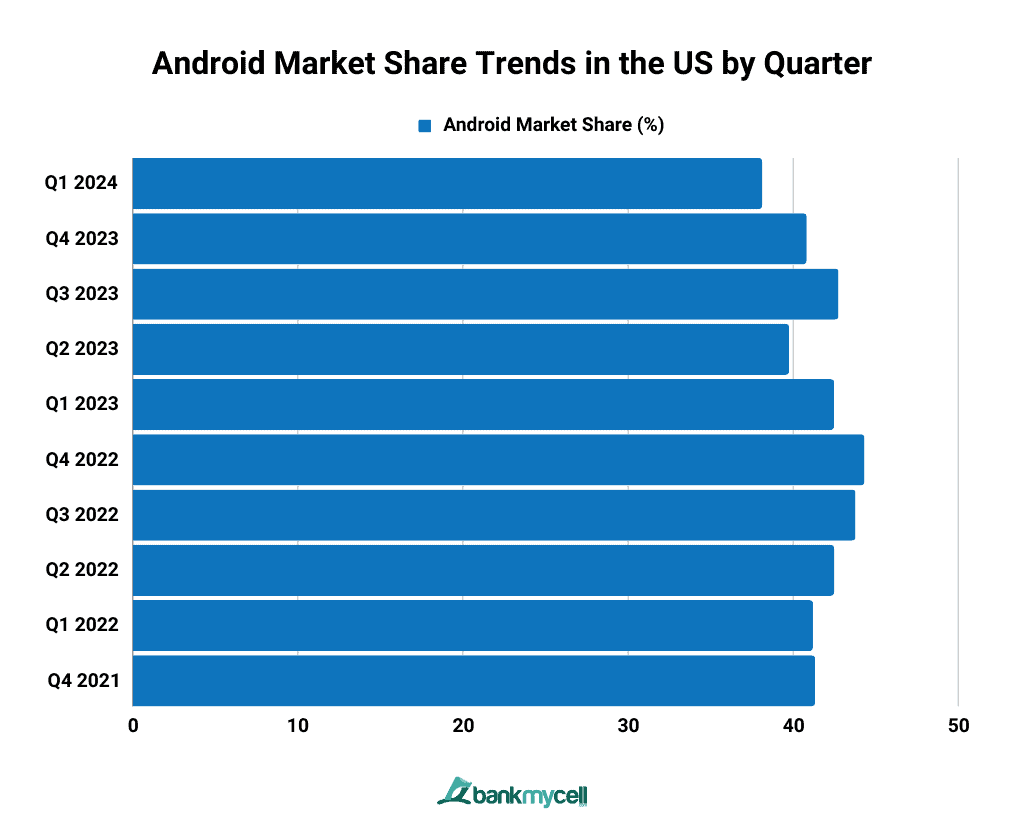
Android Market Share Trends in the US by Quarter
| Quarter | Android Market Share (%) |
|---|---|
| Q1 2024 | 38.13 |
| Q4 2023 | 40.82 |
| Q3 2023 | 42.75 |
| Q2 2023 | 39.76 |
| Q1 2023 | 42.48 |
| Q4 2022 | 44.32 |
| Q3 2022 | 43.78 |
| Q2 2022 | 42.49 |
| Q1 2022 | 41.2 |
| Q4 2021 | 41.33 |
- Data Table
-
Quarter Android Market Share (%) Q1 2024 38.13 Q4 2023 40.82 Q3 2023 42.75 Q2 2023 39.76 Q1 2023 42.48 Q4 2022 44.32 Q3 2022 43.78 Q2 2022 42.49 Q1 2022 41.2 Q4 2021 41.33 - Data Graphic
-

In the United States, Android’s quarterly market share is at 38.13%, a decline of 2.69% compared to Q4 of 2023.
In the second quarter of 2022, Samsung, the leading company that manufactures Android devices globally, garnered a 30% market share of smartphone sales in the United States.
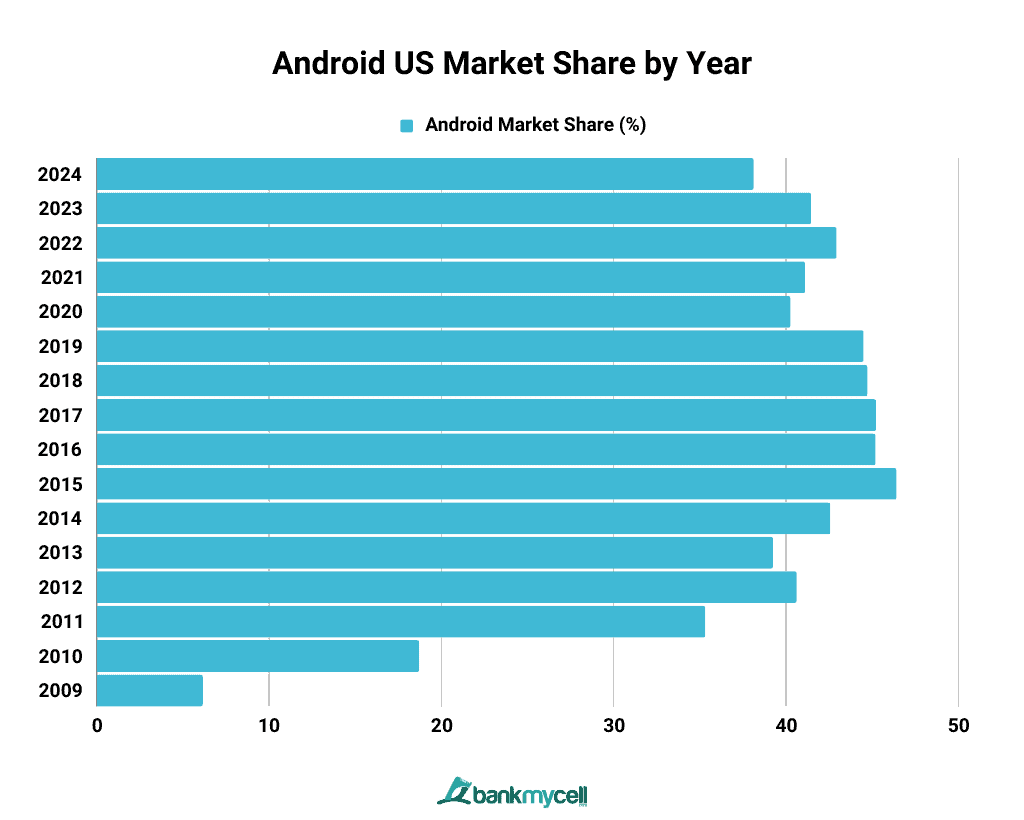
Android US Market Share by Year (2009-2024)
| Year | Android Market Share (%) |
|---|---|
| 2024 | 38.13 |
| 2023 | 41.46 |
| 2022 | 42.94 |
| 2021 | 41.11 |
| 2020 | 40.27 |
| 2019 | 44.51 |
| 2018 | 44.73 |
| 2017 | 45.23 |
| 2016 | 45.2 |
| 2015 | 46.42 |
| 2014 | 42.58 |
| 2013 | 39.25 |
| 2012 | 40.63 |
| 2011 | 35.32 |
| 2010 | 18.71 |
| 2009 | 6.16 |
- Data Table
-
Year Android Market Share (%) 2024 38.13 2023 41.46 2022 42.94 2021 41.11 2020 40.27 2019 44.51 2018 44.73 2017 45.23 2016 45.2 2015 46.42 2014 42.58 2013 39.25 2012 40.63 2011 35.32 2010 18.71 2009 6.16 - Data Graphic
-

Android’s yearly market share in America is at 38.13%, a decline of 3.33% from 2023. Although Android is only the second most popular mobile operating system in the US, its market share has stayed at 40% over the last ten years.
Market Share of iOS Worldwide
Apple’s iOS mobile operating system held around 29.39% of the global smartphone market share in the most recent quarter of 2024. It is lagging behind Android by 40% market share. Android has continued to dominate the operating system market share at 69.88%.
iOS Market Share Worldwide by Quarter
| Quarter | iOS Market Share (%) |
|---|---|
| Q1 2024 | 29.39 |
| Q4 2023 | 29.19 |
| Q3 2023 | 28.83 |
| Q2 2023 | 30.25 |
| Q1 2023 | 27.89 |
| Q4 2022 | 27.64 |
| Q3 2022 | 27.71 |
| Q2 2022 | 27.58 |
| Q1 2022 | 28.46 |
| Q4 2021 | 28.66 |
- Data Table
-
Quarter iOS Market Share (%) Q1 2024 29.39 Q4 2023 29.19 Q3 2023 28.83 Q2 2023 30.25 Q1 2023 27.89 Q4 2022 27.64 Q3 2022 27.71 Q2 2022 27.58 Q1 2022 28.46 Q4 2021 28.66 - Data Graphic
-

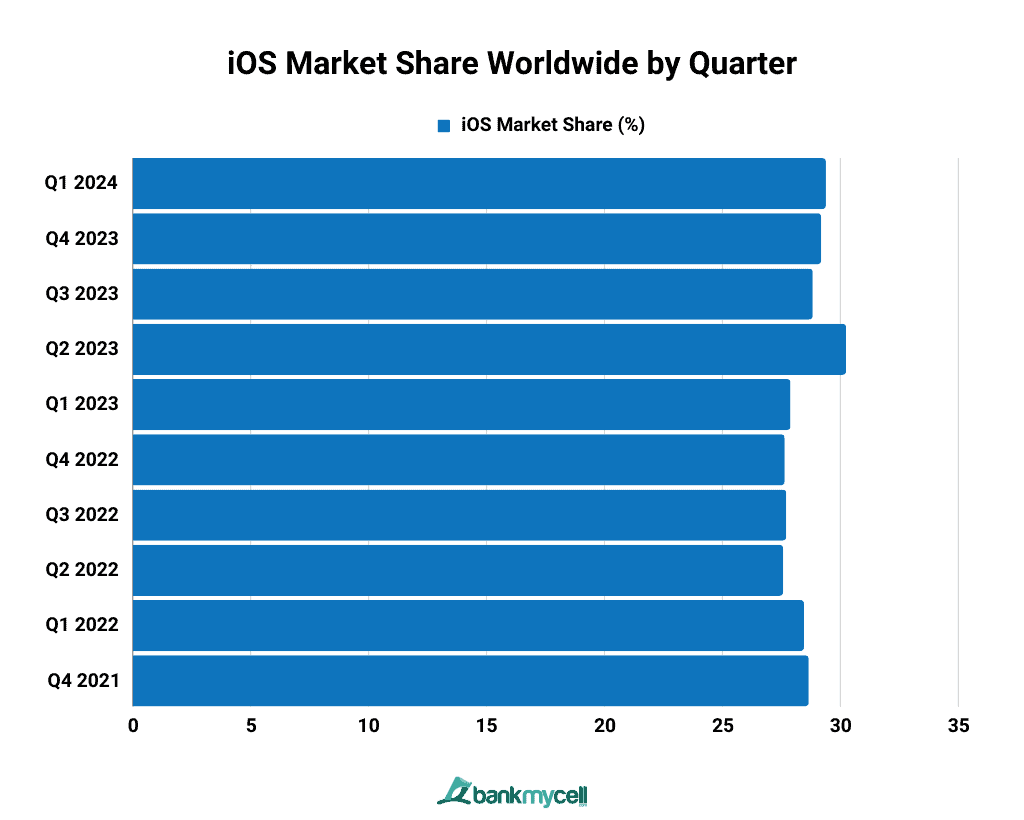
iOS generated a 29.39% market share for the most recent quarter of 2024, which is an increase of about 0.20% compared to the fourth quarter of 2023. Over the previous six quarters, iOS had the highest market share of 30.25% in Q2 2023.
iOS shows a slight increase in Q1 2022 due to high demand for the iPhone 13, the flagship device of the year in the premium segment, and the launch of the iPhone SE, which provides a budget-friendly option to iOS users. However, data shows a drop in Q2 2022
iOS Market Share by Year (2009-2024)
| Year | iOS Market Share (%) |
|---|---|
| 2024 | 29.39 |
| 2023 | 29.02 |
| 2022 | 27.85 |
| 2021 | 27.34 |
| 2020 | 26.28 |
| 2019 | 22.71 |
| 2018 | 20.47 |
| 2017 | 19.65 |
| 2016 | 19.29 |
| 2015 | 20.2 |
| 2014 | 23.95 |
| 2013 | 24.03 |
| 2012 | 24.04 |
| 2011 | 22.29 |
| 2010 | 25.48 |
| 2009 | 34.01 |
- Data Table
-
Year iOS Market Share (%) 2024 29.39 2023 29.02 2022 27.85 2021 27.34 2020 26.28 2019 22.71 2018 20.47 2017 19.65 2016 19.29 2015 20.2 2014 23.95 2013 24.03 2012 24.04 2011 22.29 2010 25.48 2009 34.01 - Data Graphic
-

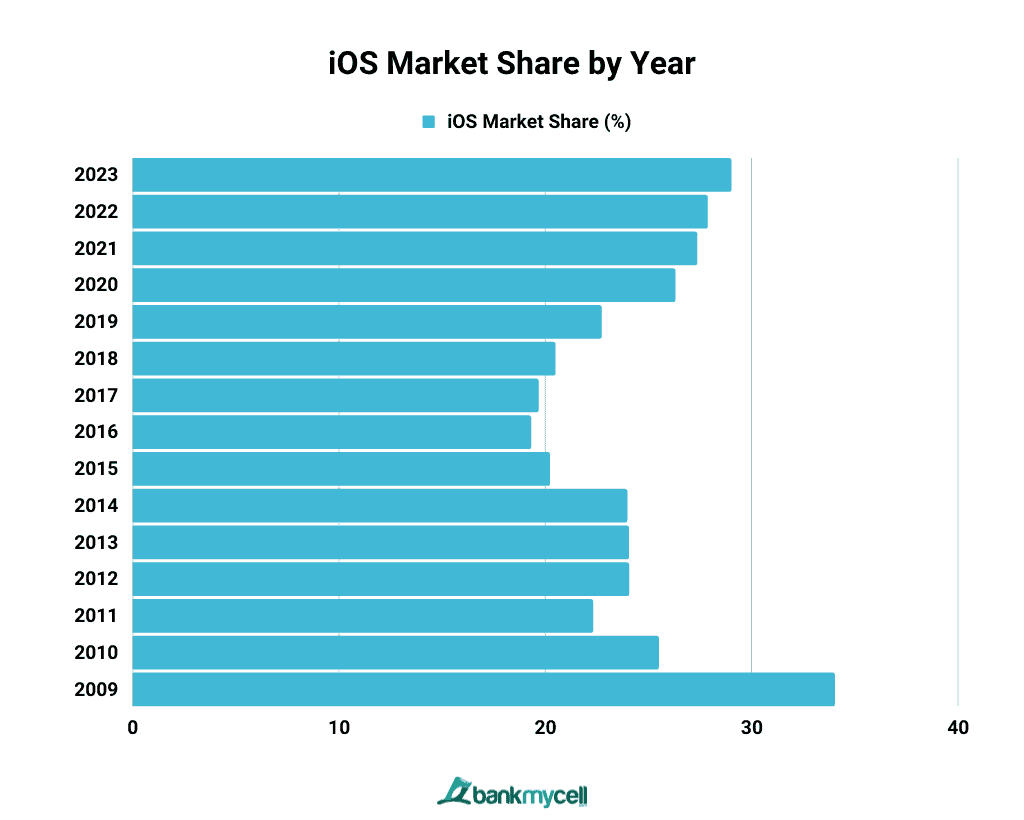
Apple’s yearly market share in 2024 is 29.39%, a 0.37% increase compared to 2023. The largest market share of Apple iOS was way back in 2009 with 34.01%, beating Android by 27.85% worldwide. However, Apple’s iOS started coming up second to Android starting from 2011 onwards.
iOS Market Share in the US
In the most recent quarter of 2024, iOS generated a 61.45% market share in the US, leading by 23.32% against Android at 38.13%. More than half of smartphone users in the US own iPhones.
iOS Market Share Trends in the US by Quarter
| Quarter | iOS Market Share (%) |
|---|---|
| Q1 2024 | 61.45 |
| Q4 2023 | 58.66 |
| Q3 2023 | 56.83 |
| Q2 2023 | 59.79 |
| Q1 2023 | 57.12 |
| Q4 2022 | 55.31 |
| Q3 2022 | 55.91 |
| Q2 2022 | 57.23 |
| Q1 2022 | 58.5 |
| Q4 2021 | 58.35 |
- Data Table
-
Quarter iOS Market Share (%) Q1 2024 61.45 Q4 2023 58.66 Q3 2023 56.83 Q2 2023 59.79 Q1 2023 57.12 Q4 2022 55.31 Q3 2022 55.91 Q2 2022 57.23 Q1 2022 58.5 Q4 2021 58.35 - Data Graphic
-

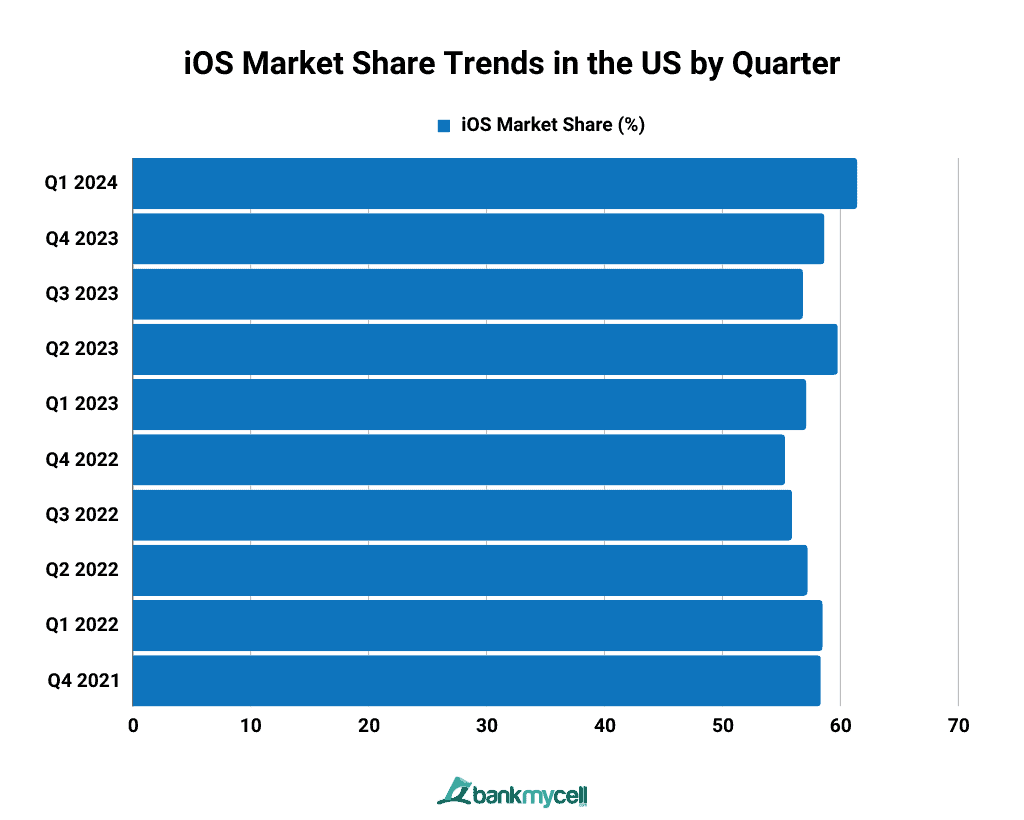
At 61.45%, iOS’ current quarterly market share in the US saw an increase of 2.79% compared to the fourth quarter of 2023.
Shipment of Apple iPhones for the third quarter of 2022 was at 51.9 million units worldwide, an increase of 7.3 million devices from the previous quarter.
iOS US Market Share by Year (2009-2024)
| Year | iOS Market Share (%) |
|---|---|
| 2024 | 61.45 |
| 2023 | 58.1 |
| 2022 | 56.74 |
| 2021 | 58.58 |
| 2020 | 59.54 |
| 2019 | 55.23 |
| 2018 | 54.82 |
| 2017 | 53.89 |
| 2016 | 53.19 |
| 2015 | 50.85 |
| 2014 | 52.3 |
| 2013 | 52.79 |
| 2012 | 49.48 |
| 2011 | 38.33 |
| 2010 | 38.31 |
| 2009 | 57.9 |
- Data Table
-
Year iOS Market Share (%) 2024 61.45 2023 58.1 2022 56.74 2021 58.58 2020 59.54 2019 55.23 2018 54.82 2017 53.89 2016 53.19 2015 50.85 2014 52.3 2013 52.79 2012 49.48 2011 38.33 2010 38.31 2009 57.9 - Data Graphic
-

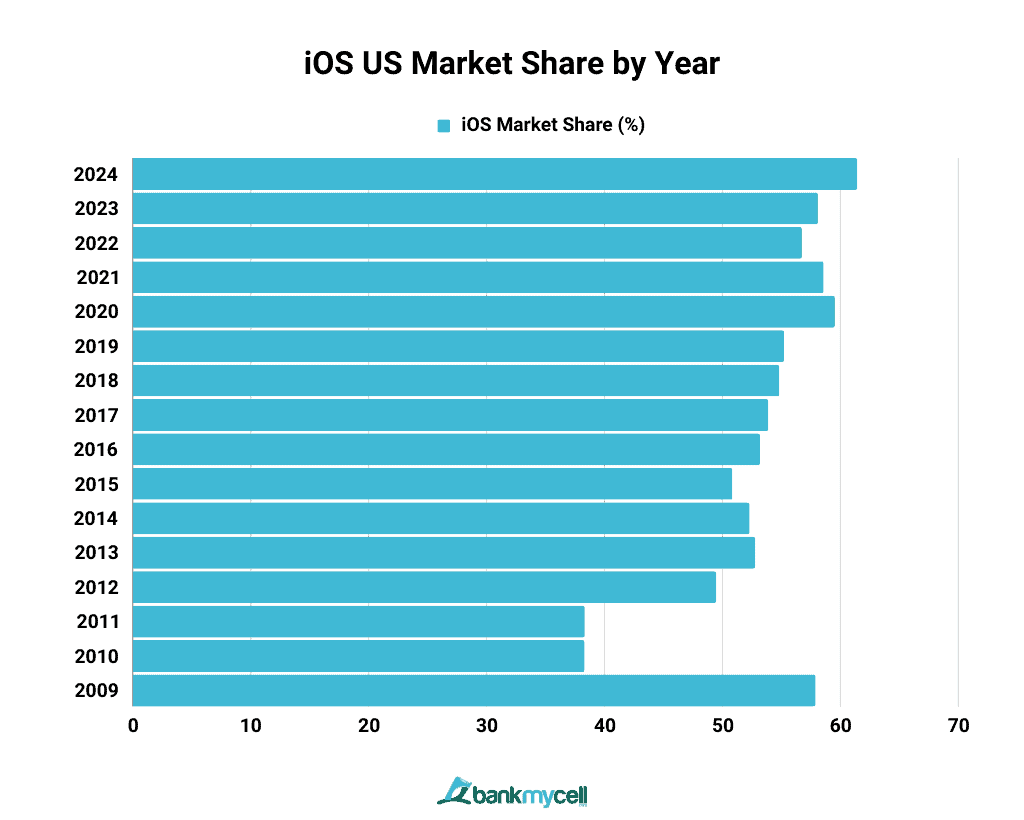
The current yearly market share for iOS in the US is at 61.45%, an increase of 3.35% compared to 2023. Apple’s iOS has remained the leading operating system in the US since 2009. Android couldn’t outperform iOS in the country throughout the years, even though it continues to dominate worldwide. The largest market share of iOS, accounting for 59.54% of the US mobile operating system market, was in 2020. It was the year when the iPhone 7 became one of the most popular phone models.