Average Screen Time: iPhone & Android Statistics (2025 Update)


What is The Average Amount of Screen Time Per Day?
Did you know that the average adult now spends six hours and 58 minutes online and on their screens per day? Approximately three hours and 43 minutes (or 53.5%) of this time are spent on mobile devices.
On this page, you will learn just how much time people face their devices’ screens per day, which countries have the highest screen time consumption, and many more.
Editors Picks:
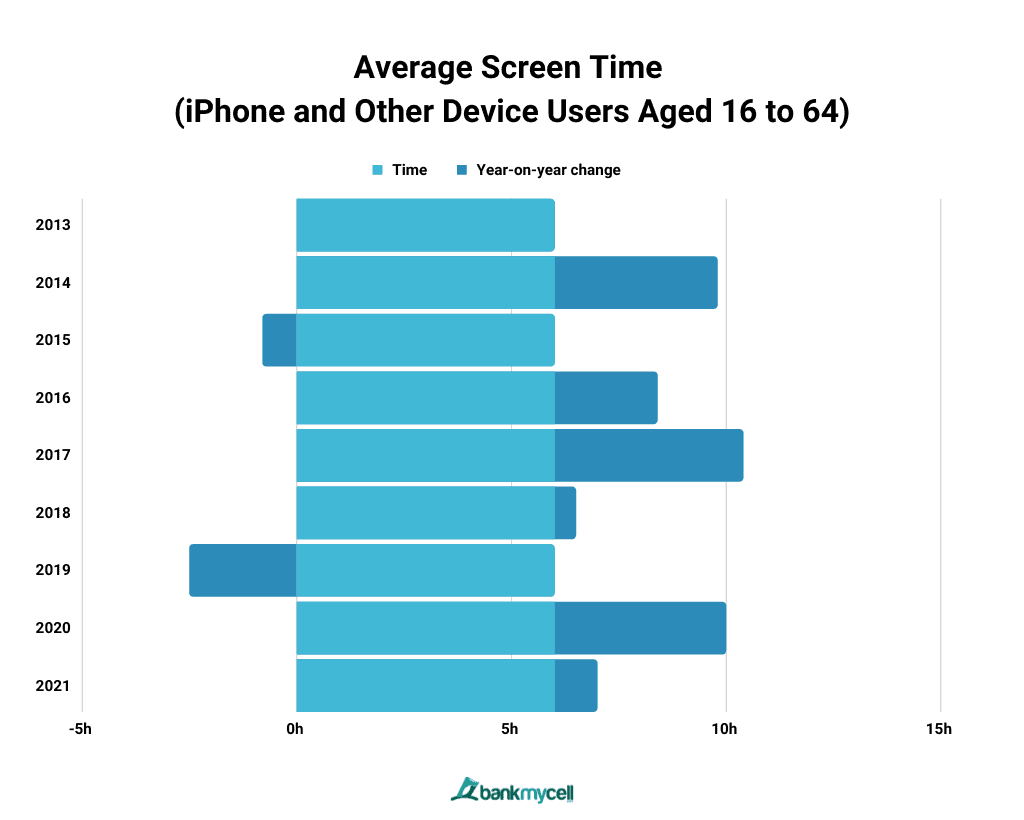
- Average screen time in total (all devices): The average screen time of adults aged 16 to 64 is 6 hours and 58 minutes. This is a four-minute increase from 2020 and a 49-minute increase from 2013.
- Average screen time in a day (smartphones): Adults spent three hours and 43 minutes, or 53.5% of their online time, looking at their phone screens, according to data. That’s a 1.3% increase from the previous year.
- Average screen time during the pandemic: Cambridge Open Engage collected data from over 3,000 Iowa State University faculty, staff, students, and alumni across the US from April 3 to 7, 2020, and discovered that their screentime increased by 20-30% on average during the pandemic.
- Times phone is picked up daily: The average person checks their phone 58 times per day, with 30 of those times occurring during work hours.
Daily Average Screen Time for Adults Worldwide
The global average of screen time for adults aged 16 to 64 is 6 hours and 58 minutes per day. This means that almost 30% of our entire day is spent in front of our screens.
Average Screen Time (iPhone and Other Device Users Aged 16 to 64)
| Year | Time (hrs & mins) | Year-on-year change |
|---|---|---|
| 2021 | 6h 58m | 1.00% |
| 2020 | 6h 54m | 4.00% |
| 2019 | 6h 38m | -2.50% |
| 2018 | 6h 48m | 0.50% |
| 2017 | 6h 46m | 4.40% |
| 2016 | 6h 29m | 2.40% |
| 2015 | 6h 20m | -0.80% |
| 2014 | 6h 23m | 3.80% |
| 2013 | 6h 09m | NA |
- Data Table
-
Year Time (hrs & mins) Year-on-year change 2021 6h 58m 1.00% 2020 6h 54m 4.00% 2019 6h 38m -2.50% 2018 6h 48m 0.50% 2017 6h 46m 4.40% 2016 6h 29m 2.40% 2015 6h 20m -0.80% 2014 6h 23m 3.80% 2013 6h 09m NA - Data Graphic
-

The data from DataReportal reports that the current global average screen time for adults between the age of 16 and 64 is 6 hours and 58 minutes. This is a four-minute increase from from the previous year and a 49-minute increase since 2013.
Key Stats:
- If we assume that the average person sleeps seven to eight hours per day, the average internet user now spends more than 40% of their waking hours online and in front of their screens.
- The year 2017 saw a 4.4% increase from 2016, marking the largest year-over-year increase in average adult screen time since 2013.
- The start of the pandemic in 2020 also saw a 4.0% increase in adults’ average screen time from 2019.
Average Screen Time per Country
Which Countries Have the Highest Screen Time?
Screen Time Consumption of Different Countries
| Country | Time (hrs & mins) |
|---|---|
| South Africa | 10:46 |
| Philippines | 10:27 |
| Brazil | 10:19 |
| Colombia | 10:03 |
| Argentina | 09:38 |
| Malaysia | 09:10 |
| Thailand | 09:06 |
| Mexico | 08:55 |
| Indonesia | 08:36 |
| UAE | 08:36 |
| Taiwan | 08:07 |
| Saudi Arabia | 08:05 |
| Egypt | 08:02 |
| Turkey | 08:00 |
| Portugal | 07:56 |
| Russia | 07:50 |
| Israel | 07:35 |
| Singapore | 07:29 |
| India | 07:19 |
| Romania | 07:09 |
| USA | 07:05 |
| Worldwide | 06:58 |
| Hong Kong | 06:46 |
| Canada | 06:45 |
| Poland | 06:39 |
| Vietnam | 06:38 |
| Ireland | 06:30 |
| New Zealand | 06:23 |
| Sweden | 06:22 |
| Australia | 06:13 |
| UK | 06:12 |
| Italy | 06:09 |
| Greece | 06:06 |
| Spain | 06:04 |
| Belgium | 05:45 |
| Switzerland | 05:44 |
| Austria | 05:42 |
| France | 05:34 |
| South Korea | 05:29 |
| Germany | 05:22 |
| China | 05:15 |
| Netherlands | 05:11 |
| Denmark | 05:02 |
| Japan | 04:26 |
- Data Table
-
Country Time (hrs & mins) South Africa 10:46 Philippines 10:27 Brazil 10:19 Colombia 10:03 Argentina 09:38 Malaysia 09:10 Thailand 09:06 Mexico 08:55 Indonesia 08:36 UAE 08:36 Taiwan 08:07 Saudi Arabia 08:05 Egypt 08:02 Turkey 08:00 Portugal 07:56 Russia 07:50 Israel 07:35 Singapore 07:29 India 07:19 Romania 07:09 USA 07:05 Worldwide 06:58 Hong Kong 06:46 Canada 06:45 Poland 06:39 Vietnam 06:38 Ireland 06:30 New Zealand 06:23 Sweden 06:22 Australia 06:13 UK 06:12 Italy 06:09 Greece 06:06 Spain 06:04 Belgium 05:45 Switzerland 05:44 Austria 05:42 France 05:34 South Korea 05:29 Germany 05:22 China 05:15 Netherlands 05:11 Denmark 05:02 Japan 04:26 - Data Graphic
-

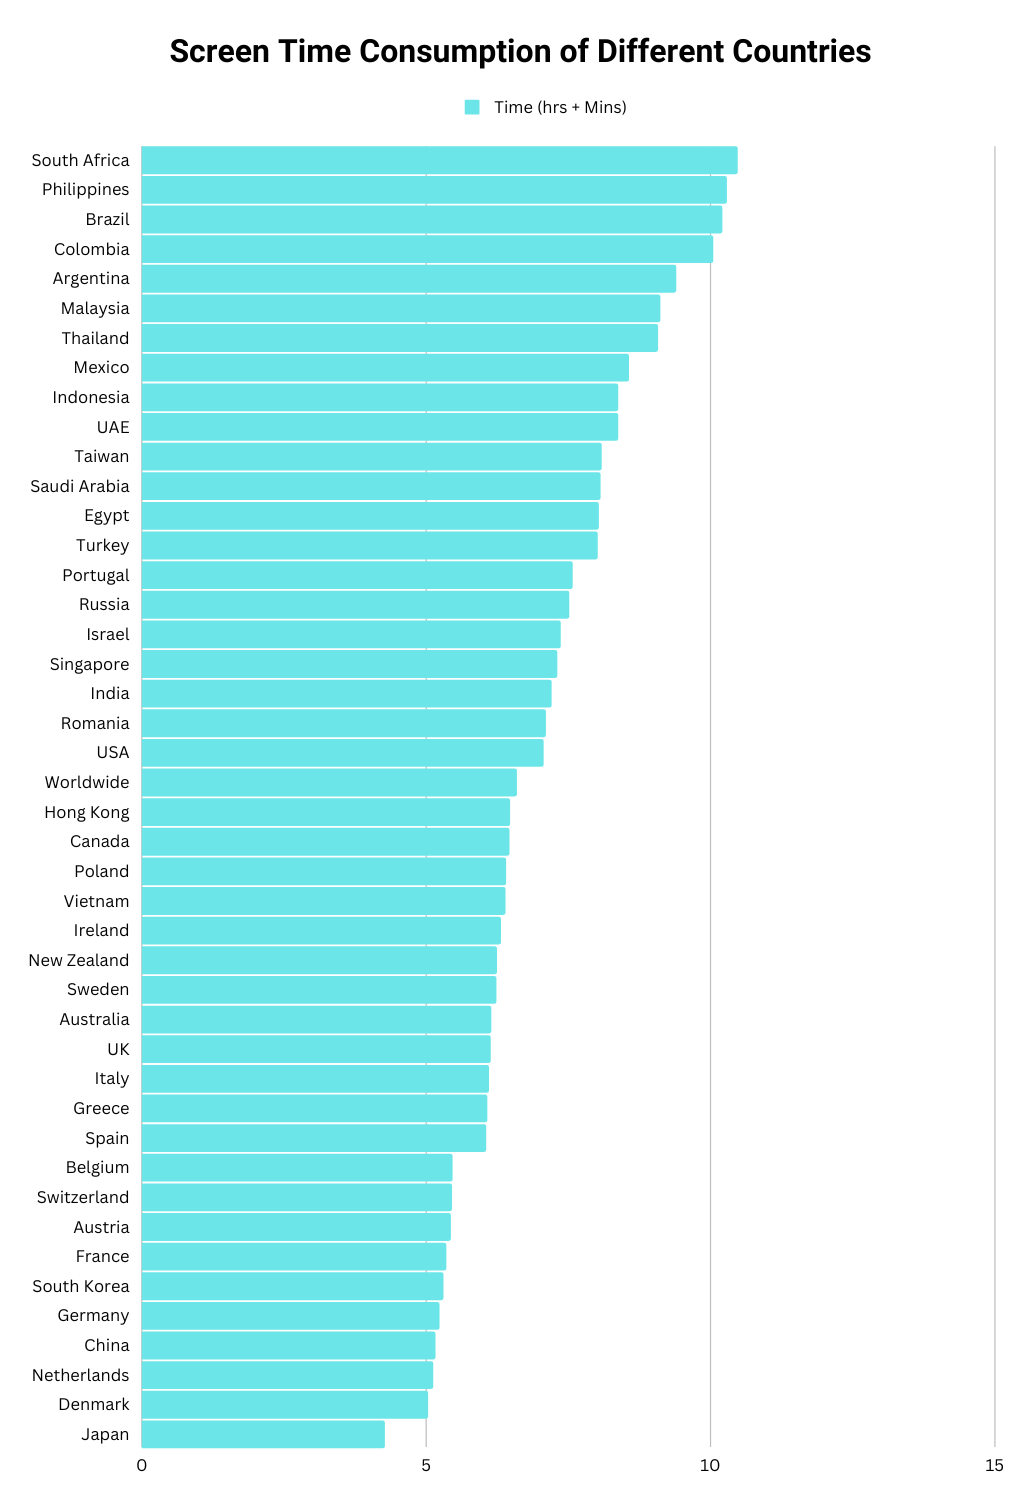
The above table shows that South Africa has the highest daily screen time in the world, with its citizens spending an average of 10 hours and 46 minutes in front of their screens, followed by the Philippines with 10 hours and 27 minutes. South American countries take the next three spots, with screen times of 10 hours and 19 minutes for Brazil, 10 hours and 3 minutes for Colombia, and 9 minutes and 38 minutes for Argentina.
Asian countries such as Malaysia and Thailand also have high daily screen times, with 9 hours and 10 minutes and 9 hours and 6 minutes, respectively.
Screen Time During the COVID-19 Pandemic
Multiple studies from different countries have found an increase in screen time among their respondents during the COVID-19 crisis.
Key Stats:
- Cambridge Open Engage gathered information from over 3,000 Iowa State University faculty, staff, students, and alumni across the US and discovered that their screentime has risen by 20-30% on average during the pandemic.
- A study in China with more than a thousand respondents found that around 70% of the participants spent more time on their screens during the COVID-19 pandemic.
- According to an online survey conducted in British Columbia in the summer of 2021, respondents spent more hours per day using technology during the pandemic (around 8.35 hours) than in previous years (6.02 hours). Increases were found to be greater among urban participants.
Average American Screen Time
The average daily screen time in the US is 7 hours and 5 minutes. This is seven minutes above the global average. The US comes in third in the countries with the highest daily screen time, next to South Africa and the Philippines, which each have average daily screen times above ten hours.
Key Stats:
- According to Apple’s screen time statistics for US users, Gen X users spend around 169 minutes per day on their phones, while Baby Boomers spend around 136 minutes.
- The National Institutes of Health in the United States discovered that even children who watch two hours of television per day perform worse on cognitive and language tests compared to their peers who don’t.
Average Phone Screen Time
How Much Time Does the Average Person Spend on their Phone?
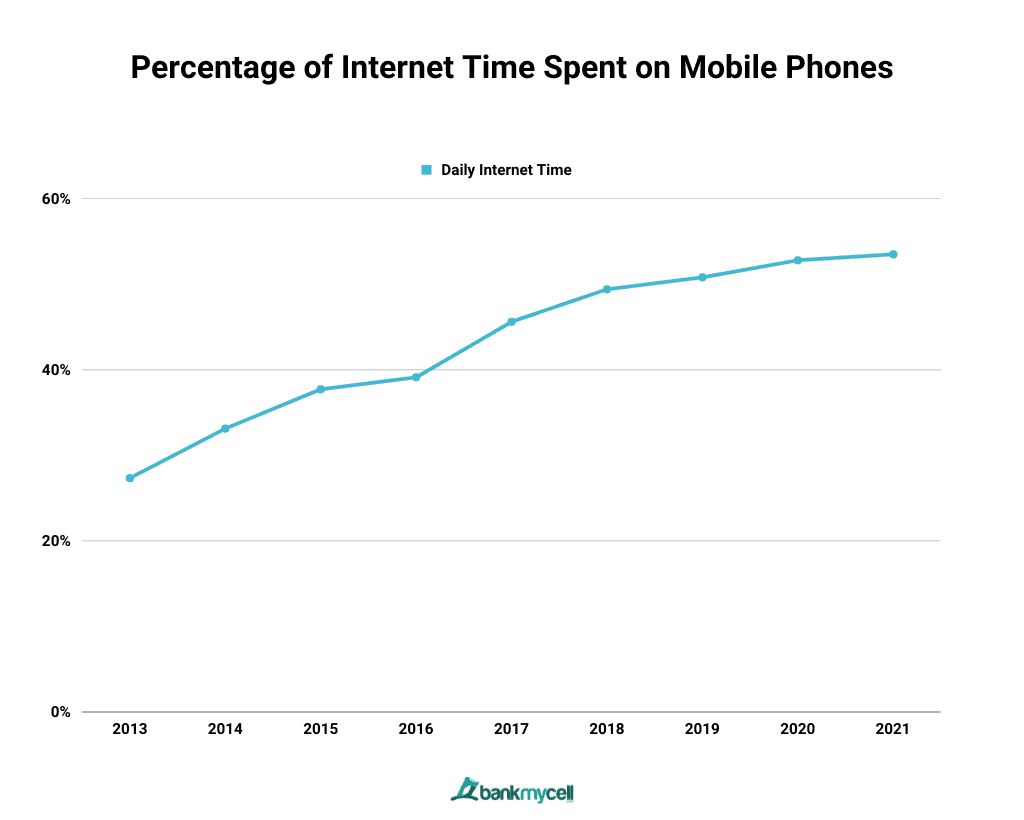
Out of adults’ total screen time or time spent online, 53.5% or approximately three hours and 43 minutes are spent on phones.
Key Stats:
- 70% of phone pick-up sessions last less than 2 minutes. They can, however, set off a chain reaction. Half of all screen time sessions begin within three minutes of the previous one.
- The average person checks their phone 58 times per day, with 30 of those times occurring during work hours.
Percentage of Internet Time Spent on Mobile Phones
Average Mobile Screen Time of Adults
| Year | Daily Internet Time |
|---|---|
| 2021 | 53.50% |
| 2020 | 52.80% |
| 2019 | 50.80% |
| 2018 | 49.40% |
| 2017 | 45.60% |
| 2016 | 39.10% |
| 2015 | 37.70% |
| 2014 | 33.10% |
| 2013 | 27.30% |
- Data Table
-
Average Mobile Screen Time of Adults
Year Daily Internet Time 2021 53.50% 2020 52.80% 2019 50.80% 2018 49.40% 2017 45.60% 2016 39.10% 2015 37.70% 2014 33.10% 2013 27.30% - Data Graphic
-

Key Stats:
- In 2016, people had been using the internet via their phones for 2 hours and 31 minutes per day. The figures increased by 8.3% between 2017 and 2019.
- In 2019, mobile phone users connected to the internet for around three hours and 32 minutes per day. It increased to three hours and 40 minutes in 2020.
Daily Time Spent on Different Kinds of Media
Daily Screen Time on Various Types of Devices/Media
| Type of Media/Device | Time Spent | Year-on-Year Change |
|---|---|---|
| Internet | 6h 58m | +1.0% (+4M) |
| Television (Broadcast & Streaming) | 3h 20m | -2.0% (-4M) |
| Social Media | 2h 27m | +1.4% (+2M) |
| Press (Online & Physical Print) | 2h 00m | -1.6% (-1M) |
| Music Streaming Services | 1h 33m | +2.2% (+2M) |
| Broadcast Radio | 1h 01m | [UNCHANGED] |
| Games Console | 1h 12m | +1.9% (+1M) |
| Podcasts | 0h 55m | +1.4% (+1M) |
- Data Table
-
Daily Screen Time on Various Types of Devices/Media
Type of Media/Device Time Spent Year-on-Year Change Internet 6h 58m +1.0% (+4M) Television (Broadcast & Streaming) 3h 20m -2.0% (-4M) Social Media 2h 27m +1.4% (+2M) Press (Online & Physical Print) 2h 00m -1.6% (-1M) Music Streaming Services 1h 33m +2.2% (+2M) Broadcast Radio 1h 01m [UNCHANGED] Games Console 1h 12m +1.9% (+1M) Podcasts 0h 55m +1.4% (+1M) - Data Graphic
-

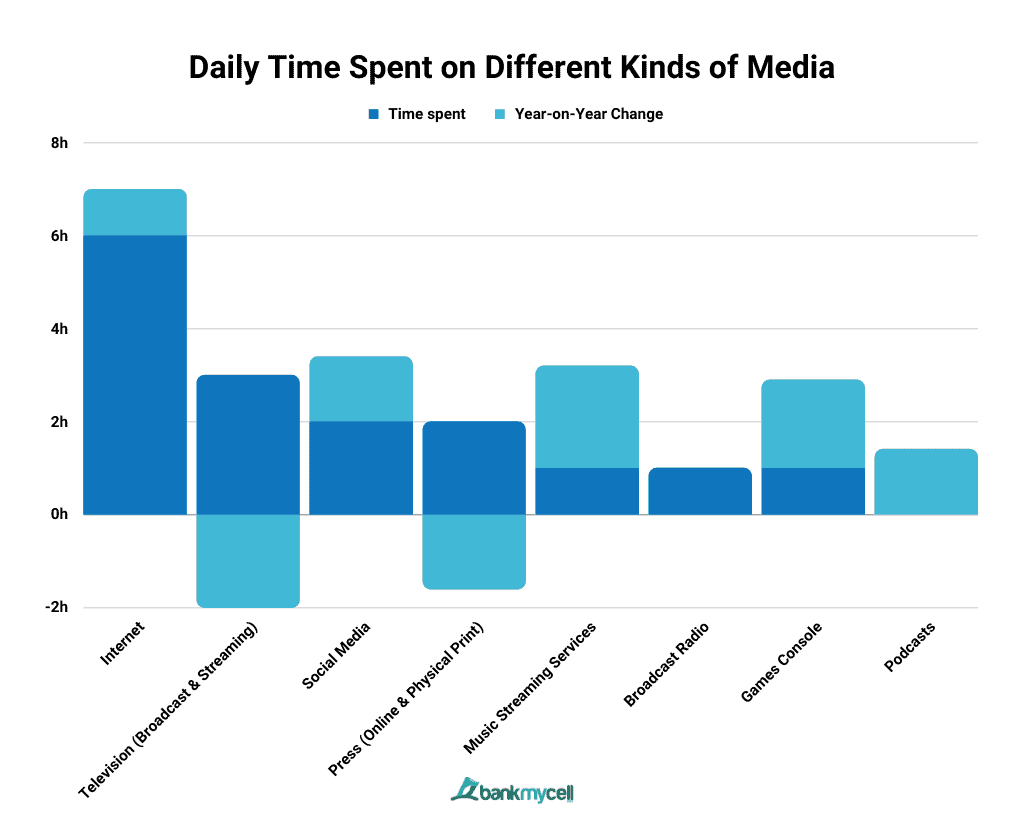
The internet has the highest time spent on a type of media, wherein adult users between 16 and 64 stay online for around 6 hours and 58 minutes per day. It is followed by time spent using the television (both to stream and to broadcast), where people spend the day watching TV for 3 hours and 20 minutes.
Key Stats:
- People spend the least amount of time on their phones listening to podcasts, with only 55 minutes per day. However, the most recent data show a 1.4% year-on-year increase, or an addition of one minute.
- According to the most recent statistics, people listen to broadcast radio for one hour and one minute daily, with no year-on-year change.
- Over the last year, global daily internet time has increased by four minutes, while daily TV viewing time has declined by four minutes.
- Over the last year, the majority of employed internet users who own a television streaming device such as an Apple TV or a Chromecast has increased by 7.6%.
- A sharp rise in screen time spent watching entertainment both before and during the COVID-19 pandemic was associated with a significant increase in anxiety among people.
How Much Time Does the Average Person Spend on Social Media?
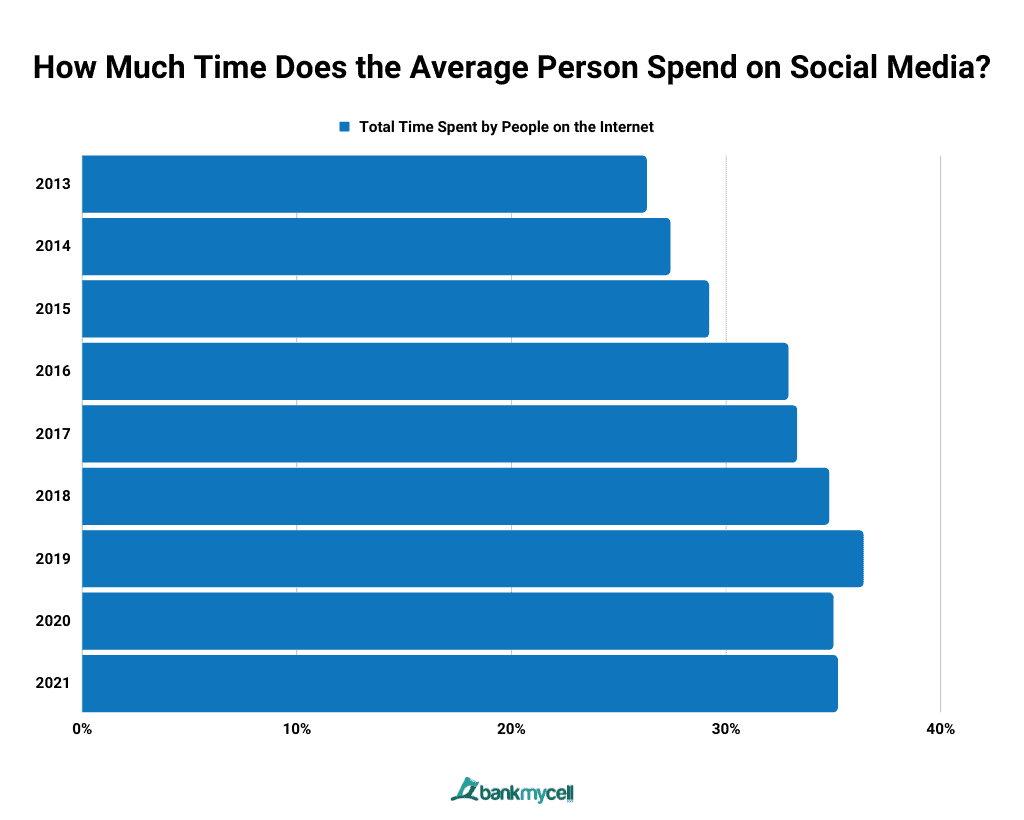
The total time spent of people on social media takes 35.2% of their total internet time, or approximately 2 hours and 27 minutes. Currently, this time has increased by 8.9% since 2013, adding 38 more minutes per day.
Social Media Screen Time
| Year | % Total Time Spent by People on the Internet |
|---|---|
| 2021 | 35.20% |
| 2020 | 35.00% |
| 2019 | 36.40% |
| 2018 | 34.80% |
| 2017 | 33.30% |
| 2016 | 32.90% |
| 2015 | 29.20% |
| 2014 | 27.40% |
| 2013 | 26.30% |
- Data Table
-
Social Media Screen Time
Year % Total Time Spent by People on the Internet 2021 35.20% 2020 35.00% 2019 36.40% 2018 34.80% 2017 33.30% 2016 32.90% 2015 29.20% 2014 27.40% 2013 26.30% - Data Graphic
-

Key Stats:
- People were spending about 2 hours and 32 minutes per day on social media in 2019. By 2020, it decreased by 6 minutes.
- People were only using social media on their phones for about 1 hour and 54 minutes per day in 2014. By 2020, users were already averaging up to 2 hours and 26 minutes of daily usage.
- According to the online measurement company SimilarWeb, time spent with some of the most popular social media apps, such as Facebook, Instagram, and Snapchat, has decreased as a result of “time well spent” initiatives. “Time well spent” is a movement aimed at developing technology that respects users’ time and enables them to “digitally detox.”
Recommendations: How Many Hours of Screen Time is Healthy?
According to Dr. Yalda Uhls, a professor of psychology who studies screen time health effects, the type of content you consume matters more than the duration of time you spend in front of a screen. Experts, however, have some recommendations to create healthier as to create healthier habits with screen time.
Key Stats:
- Limiting social media screen time to only 30-60 minutes per day helps with better well-being.
- According to Dr. Dimitri Christakis, director at Seattle Children’s Research Institute, spending at least three to four hours per day fully disconnected from phones and screens is good for a balanced screen time. His research also discovered that screen time has an impact on children’s language skills and is associated with potential behavioral problems.
- According to Vivian Tran, MD, internal medicine physician at Scripps Clinic Mission Valley, some tips to reduce screen time and mitigate its negative effects include looking away from your screen and staring at a distant object for 20 seconds every 20 minutes.
- Dr. Gregory Marcus, associate chief of Cardiology at UCSF Health, recommends spending an hour before bedtime without phone screens to get better sleep quality.
- Turning off notifications, leaving your phone out of the bedroom, and setting a timer are some ways to reduce screen time.
How Much Screen Time is Too Much?
Experts avoid imposing universal limits to screen time, although they provided some guidelines you can use to check if your screen time might already be excessive. They recommend evaluating yourself if the following aspects of your health are achieved. If you are successful in doing so, then there should be nothing to worry about your screen time.
- Sleeping well
- Eating well
- Being social and spending enough time outside the house
- Work life is going well
- Being physically active
Excessive screen time is linked to negative effects such as the following:
- Poorer cognitive performance. According to 2020 research, those diagnosed with an addiction to smartphones have problems with parts of their brain that is responsible for message transmission, resulting in poorer cognitive performance.
- Eye strain. Too much screen time can harm the eyes, and many adults are now suffering from eye strain. This condition is caused by focusing too closely on a phone screen for an extended period of time, which causes eye pain, eye fatigue, and even blurred vision.
- Eye damage. Excessive screen time can cause eye damage due to computer vision syndrome. 75% of workers who regularly use computer screens are already affected by this. According to studies, we blink 66% less when working on a computer.