Cell Phone Depreciation Statistics
2019-2020's Biggest Winners And Losers

Smartphone Depreciation Intro
It’s no surprise that cell phones depreciate fast with the endless volume of yearly releases – Your shiny new smartphone can quickly become outdated! Most consumers rely on trade-ins to minimize the ever-increasing price ticket on the latest smartphones, but as you’ll see below, some resale value drops will make them cry.
Through 2019-2020, cell phone trade-in site BankMyCell tracked almost 300 phones resale values from multiple vendors hourly, see what we discovered right here.
Quick Links To The Data
Consumer-Focused Report Summary
6 Most Shocking Price Drop Discoveries
Flagship Android Devices Lose Value Twice as Fast as iOS

In the first year, on average, iPhones lost -23.45%; by year two, the total loss is -45.46%. The scary news for $700+ Android flagship users is, the average iPhone’s two-year loss is the same as their one-year depreciation -45.18%!
- Tracking devices over 4 years, iPhone trade-in value decline is a steady decline, losing between -23.45% to -33.09% year on year.
- In two years, the average iPhone would lose -45.46% of its original resale value -23.45% in year one and -28.75% in year two.
- In two years, the average Android flagship phone would lose –71.41% of its original resale value, -45.18% and year two -47.85%.
Learn More: Jump to data
Budget Android Devices Lose Half Their Value in Year One

On average, Android devices with launch prices of $350 or under lose half their trade-in value in just one year. Owners of popular budget smartphone brands like Samsung, Motorola, LG, HTC, and Google lost an average of -48.65% of their trade-in value in 2019-2020.
- In two years, the average budget Android phone would lose –79.66% of its original resale value, -48.65% and year two -44.26%.
- Using these average losses, a budget Android released at $299 would only be worth around $27 for trade-in after 3 years.
- Motorola One released for $349 in Oct 2018, in 14 months it lost 87.68% of its original trade-in value, fetching a measly $43 resale by December 2019.
Learn More: Jump to data
2018's iPhones Only Lost 23.45% of Their Resale Value, Unlike the S10

The three iPhones released in 2018 make up 15.29% of trade-in on the site, and it’s no surprise, as they only lost an average of 23.45% in 2019, so consumers get buyback offers that make upgrades affordable.
- iPhone XR lost -21.55% of its trade-in value in the whole of 2019, compared with the Galaxy S10e losing -37.98% in only 9 months.
- iPhone XS lost -23.31% of its trade-in value in the whole of 2019, compared with the Galaxy S10 losing -43.78% in only 9 months.
- iPhone XS Max lost -25.51% of its trade-in value in the whole of 2019, compared with the Galaxy S10+ losing -45.26% in only 9 months.
Learn More: Jump to data
Upgrade Shock: Motorola, LG & Google Worst Phones for Price Retention

Across nine popular smartphone brands, we tracked the ones losing the most trade-in value in 2019. According to the trade-in price data we receive, Owners of Motorola, LG, and Google smartphones are most likely to fetch low trade-in deals.
- Motorola lost an average of -59.41% between Jan-Dec 2019. The Motorola One (2018) was the fastest depreciating and highest value loss at -75.84% (-$135)
- LG lost an average of -56.76% between Jan-Dec 2019. The Nexus 5X (2015) was the fastest depreciating at -70.59%, while 2017’s V30 lost the highest value -$145.
- Google lost an average of -51.68% between Jan-Dec 2019. The Pixel 3 (2018) was the fastest depreciating and highest value loss at -56.70% (-$267)
Learn More: Jump to data
The Worst Drops in 2019
- Devices on the Android OS were the only phones to lose over $180 up to $373 in 2019.
- The Galaxy S10+ lost the most value in 2019, with -$373 dropping off its value
- The Google Pixel 3 lost $267 (-56.70%) of its resale value after only being released in Nov-2018
- Android dominates in the top 10 depreciating phones of 2019 that got released in 2018, with losses ranging from 52.38% (Pixel 3 XL) to 75.84% (Motorola One)
Learn More: Jump to data
Early Warning for Motorola G7 owners
- Motorola is the only brand in the top 10 with 3 huge depreciation declines from devices released in under 2 years. Motorola One, G7 Play & G7 Power
- G7 Play ($199 new) lost -84.42%, the G7 Power ($249 new) lost -81.53% and the G7 ($299 new) lost -76.25%
Learn More: Jump to data
Android VS iOS Depreciation
4-Year Operating System Price Drops
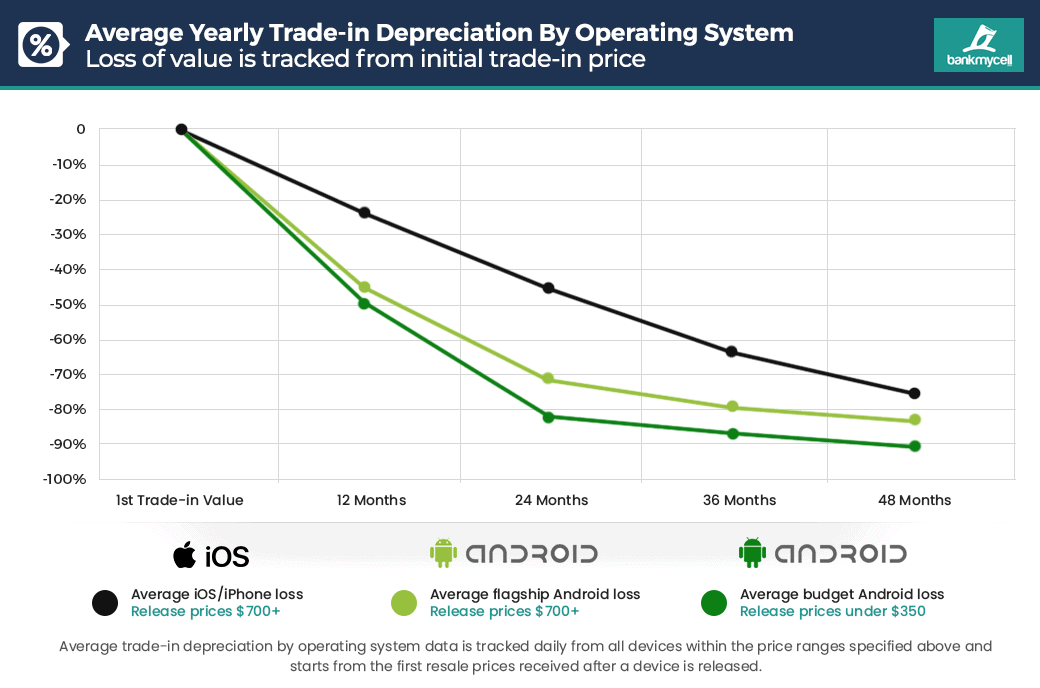
By tracking hourly buyback program pricing drops on almost 300 devices from their initial trade-in value, we’ve mapped out the average yearly depreciation of flagship iOS and Android devices, as well as budget Android phones below $350.
As you’ll see from the chart below, the depreciation of iOS devices is very consistent compared to flagship Android phones that drop in value at twice the rate in the first 24 months. Consumers that opt for budget Android phones my want to shed a tear too; in under 2-years, the average device loses -79.66% of its resale value.
- iOS devices lose an average of -23.45% of their resale value in the first year, with 4 year loses ranging between 45% to 33.09% year on year
- Compared to iPhones, on average, Android flagship phones depreciate twice as fast, losing 45.18% of their trade-in value in the first year (iPhone’s lose 45.46% on average by the end of year two).
- Android devices suffer huge trade-in losses of 71.41% to 79.66% in the first 2 years, then depreciation less than 10% in years 3&4
- Budget Android resale value drops are the most aggressive, losing half of their resale value in one year, with an average decline across the brands of -48.65%.
Android & iOS 4-year average trade-in depreciation
Data source: Depreciation figures above measure the phone’s initial trade-in value, tracking its decline over 4 years. We used the top ‘good’ condition price from multiple trade-in stores; all storage sizes were considered in the valuation.
iPhone Example Depreciation
Based on this data, if an iPhones trade in value was $850 on day one, this is how much you can expect it to depreciate over 4 years.
| # | DAY 1 TRADE IN VALUE | YEAR 1 | YEAR 2 | YEAR 3 | YEAR 4 |
|---|---|---|---|---|---|
| Trade in Value | $850 | $651 | $464 | $310 | $208 |
| Avg. Year % Loss | 0 | -23.45% | -28.75% | -33.09% | -33.08% |
| Value Loss | 0 | -$199 | -$187 | -$153 | -$103 |
| Total Depreciation | 0 | -23.45% | -45.46% | -63.51% | -75.58% |
Flagship Android Example Depreciation
Based on this data, if a new Android phones trade in value was $850 on day one, this is how much you can expect it to depreciate over 4 years.
| # | DAY 1 TRADE IN VALUE | YEAR 1 | YEAR 2 | YEAR 3 | YEAR 4 |
|---|---|---|---|---|---|
| Trade in Value | $850 | $466 | $243 | $175 | $142 |
| Avg. Year % Loss | 0 | -45.18% | -47.85% | -28.11% | -18.46% |
| Value Loss | 0 | -$384 | -$223 | -$68 | $32 |
| Total Depreciation | 0 | -45.18% | -71.41% | -79.45% | -83.24% |
Budget Android Example Depreciation
Based on this data, if a budget Android phones trade in value was $205 on day one, this is how much you can expect it to depreciate over 4 years.
| # | DAY 1 TRADE IN VALUE | YEAR 1 | YEAR 2 | YEAR 3 | YEAR 4 |
|---|---|---|---|---|---|
| Trade in Value | $205 | $105 | $42 | $27 | $19 |
| Avg. Year % Loss | 0 | -48.65% | -44.26% | -35.91% | -27.83% |
| Value Loss | 0 | -$100 | -$146 | -$167 | -$178 |
| Total Depreciation | 0 | -48.65% | -79.66% | -86.76% | -90.76% |
Tip: If you’re looking to cash in on your old device during an upgrade, yearly trade-ins are the only option to get a reasonable payout for Android devices. iPhone owners can sit pretty on a two-year cycle before they shop around for the latest device.
Cell Phone Depreciation By Brand
2019-2020 Manufacturer Price Drops
The data below is especially helpful for consumers looking to understand which smartphone brands will have excellent price retention and which will tumble in value.
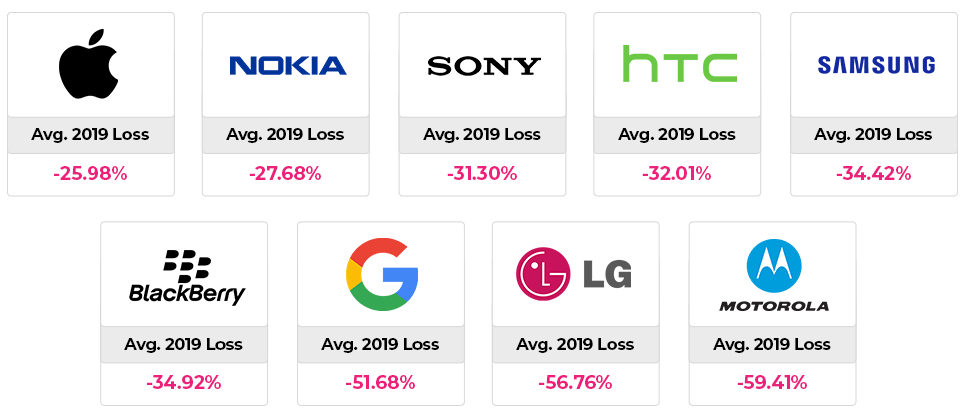
Smartphone owners of Google Pixel, LG, or Motorola devices better sit down. With average 2019-2020 smartphone resale depreciation values of 59.41%, consumers owning these brands can expect bad news when it comes to cashing in on their old tech. As you can expect from the iOS data above, iPhones are the most stable, depreciating, on average, at half the rate of an LG, Motorola, or Google Pixel phone year on year.
2019-2020 Average smartphone depreciation by brand
Ranked Best to Worst:
- Apple devices lost an average of -25.98% between Jan – Dec 2019
- Nokia devices lost an average of -27.68% between Jan – Dec 2019
- Sony devices lost an average of -31.30% between Jan – Dec 2019
- HTC devices lost an average of -32.01% between Jan – Dec 2019
- Samsung devices lost an average of -34.42% between Jan – Dec 2019
- BlackBerry devices lost an average of -34.92% between Jan – Dec 2019
- Google devices lost an average of -51.68% between Jan – Dec 2019
- LG devices lost an average of -56.76% between Jan – Dec 2019
- Motorola devices lost an average of -59.41% between Jan – Dec 2019
Data source: Depreciation figures measure the best available ‘good’ condition trade-in value from 01/01/19 to 12/31/19. This data is from multiple stores covering almost 300 devices, including all storage capacities.
How much did most popular phones lose by brand
How much did the most popular devices consumers are trading in right now lose? We looked at the phones being valued the most across Apple, Samsung, Google, LG, and Motorola to see which price drops are impacting consumers right now.
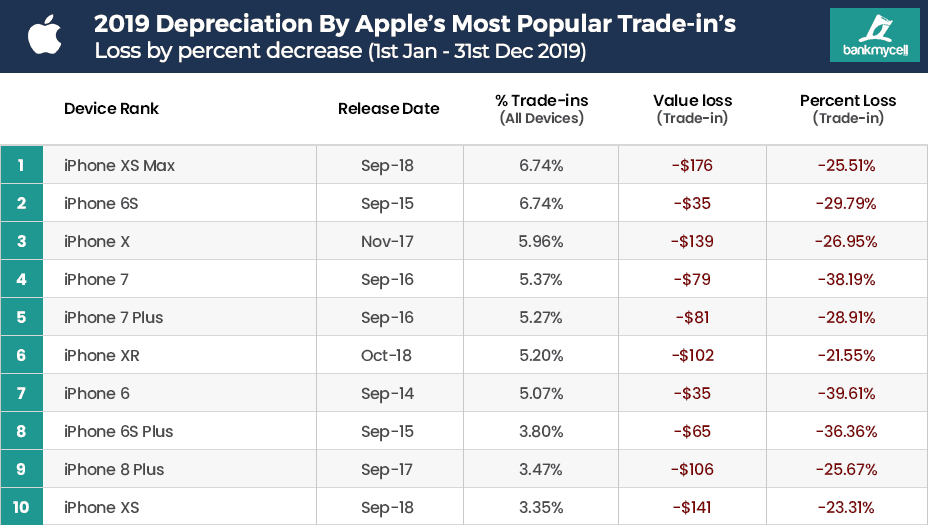
Below we see 2019-2020’s Apple iPhones ranked by trade-in popularity, showing the value decline most consumers owning an iPhone are seeing.
- Owners of the 10 most traded in iPhones in 2019 lost -21.55% to -39.61% of the value of their phone in 12 months
- 2016’s iPhone 7 was the fastest depreciating out of the 10 most sold iPhones on the site at -38.19%
- 2018’s iPhone XS Max lost the highest value, -$176 between Jan-Dec 2019 and was also the highest physical value lost across all iPhone’s (ignoring popularity)
Ignoring trade-in popularity, the iPhone 5 depreciated the most out of 200+ phones in one year, losing -93.10% of its value between Jan-Dec 2019 (although it’s worth next to nothing losing -$27 and ending the year worth $2).
Data source: We ranked each brand below by the most popular devices being trade-in from 01/01/19 to 12/31/19. Trade-in depreciation and value loss data is from the top price on multiple US buyback stores taking the ‘Good’ condition and showing averages from all storage capacities.
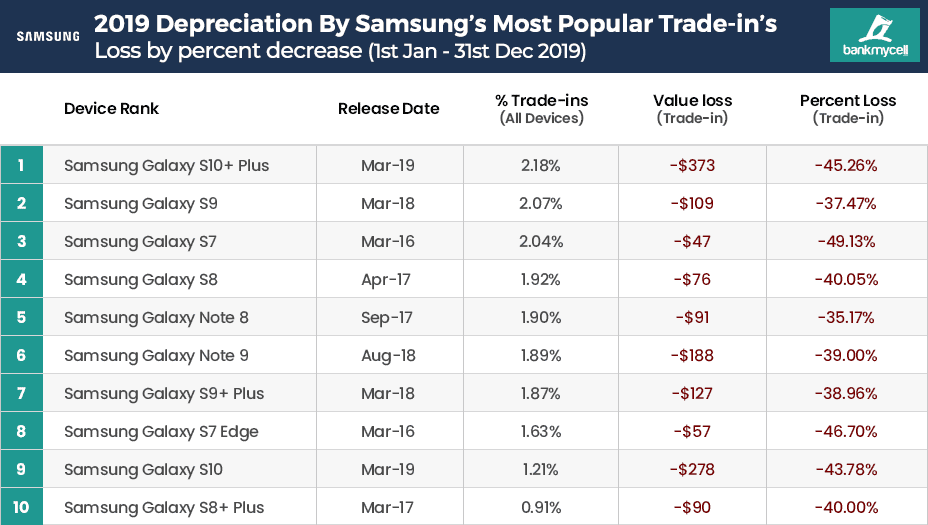
Below we see 2019-2020’s Samsung phones ranked by trade-in popularity, showing the value decline most consumers owning a Galaxy phone are seeing.
- Owners of the 10 most traded in Samsung phones in 2019 lost -35.17% to -49.13% of the value of their phone in 12 months
- 2016’s Galaxy S7 was the fastest depreciating out of the 10 most sold Samsung phones on the site at -49.13%
- 2019’s Galaxy S10+ lost the highest value, -$373 between Mar-Dec 2019, and was also the highest physical value lost across 200+ phones
Ignoring trade-in popularity, the Galaxy A6 2018 depreciated the most in one year losing -75.00% of its value between Jan-Dec 2019 (-$120)
Data source: We ranked each brand below by the most popular devices being trade-in from 01/01/19 to 12/31/19. Trade-in depreciation and value loss data is from the top price on multiple US buyback stores taking the ‘Good’ condition and showing averages from all storage capacities.
Below we see 2019-2020’s Google phones ranked by trade-in popularity, showing the value decline most consumers owning a Pixel phone are seeing.
- Owners of the 7 most traded in Google phones in 2019 lost –69% to -56.70% of the value of their phone in 12 months, on average losing half!!!
- 2018’s Pixel 3 was the fastest depreciating out of the 7 most sold Google Pixel’s on the site at -56.70%
- 2018’s Pixel 3 was also the device that lost the highest value, -$267 between Jan-Dec 2019
*The Pixel 4 was not included in this table due to its late release and lack of data.
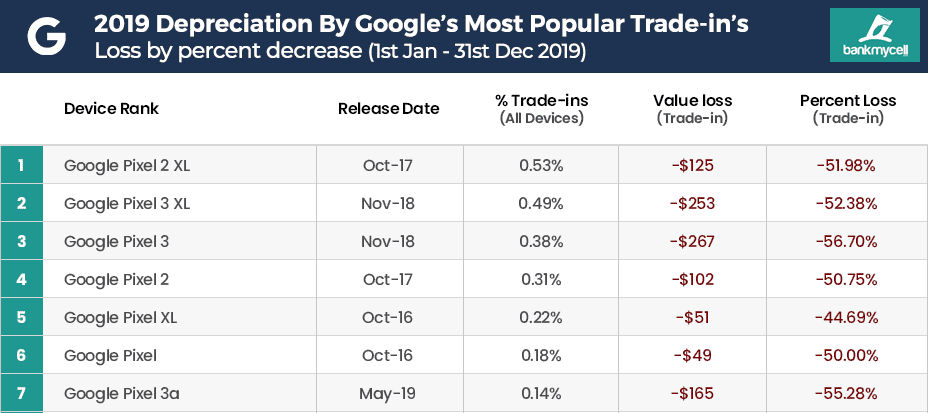
Data source: We ranked each brand below by the most popular devices being trade-in from 01/01/19 to 12/31/19. Trade-in depreciation and value loss data is from the top price on multiple US buyback stores taking the ‘Good’ condition and showing averages from all storage capacities.
Below we see 2019-2020’s LG phones ranked by trade-in popularity, showing the value decline most consumers owning an LG phone are seeing.
- Owners of the 10 most traded in LG phones in 2019 lost -29.41% to -70.59% of the value of their phone in 12 months
- 2015’s Nexus 5X was the fastest depreciating out of the 10 most sold LG phones on the site at -70.59%
- 2017’s V30 lost the highest value, -$145 between Jan-Dec 2019
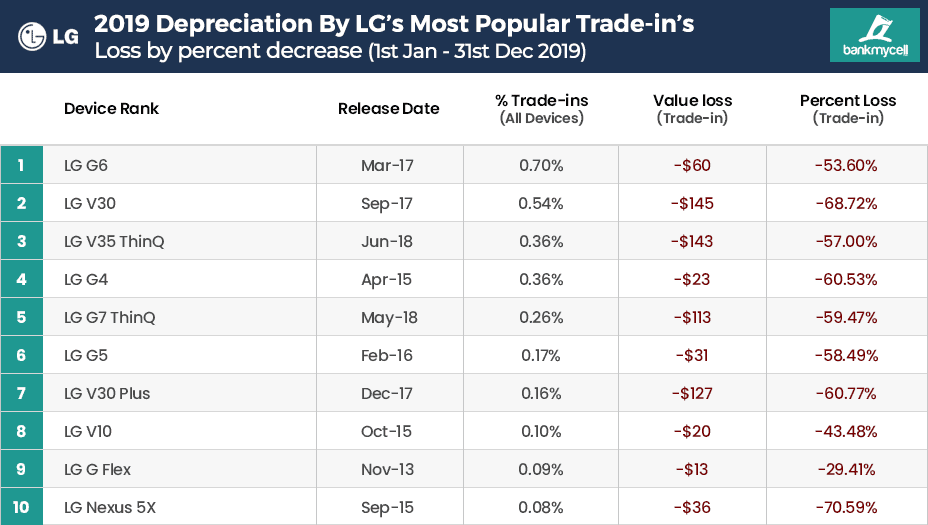
Data source: We ranked each brand below by the most popular devices being trade-in from 01/01/19 to 12/31/19. Trade-in depreciation and value loss data is from the top price on multiple US buyback stores taking the ‘Good’ condition and showing averages from all storage capacities.
Below we see 2019-2020’s Motorola phones ranked by trade-in popularity, showing the value decline most consumers owning a Moto phone are seeing.
- Owners of the 10 most traded in Motorola phones in 2019 lost -32.89% to -75.84% of the value of their phone in 12 months
- 2018’s Motorola One was the fastest depreciating out of the 10 most sold Motorola phones on the site at -75.84%
- 2018’s Motorola One lost the highest value, -$135 between Jan-Dec 2019, and was also the highest physical value lost across all Moto’s (ignoring popularity)
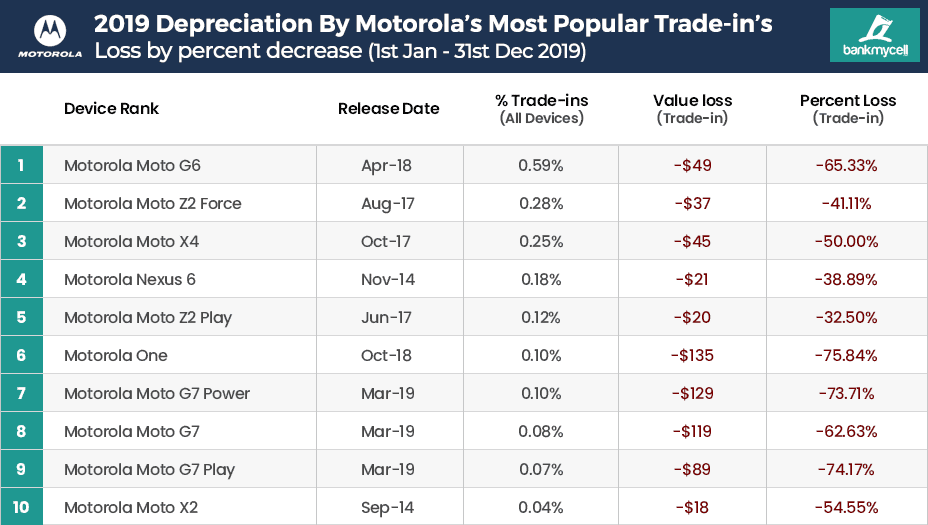
Data source: We ranked each brand below by the most popular devices being trade-in from 01/01/19 to 12/31/19. Trade-in depreciation and value loss data is from the top price on multiple US buyback stores taking the ‘Good’ condition and showing averages from all storage capacities.
Device Depreciation Biggest Losers
2019-2020 Price Drop By Value & Percent
In the traditional ‘biggest loser’ fashion, the charts below show the devices that depreciated the most in the year of 2019-2020, as well as the phones that lost the most physical value. These top 10’s show all devices regardless of release date or value.
Highest depreciating phones in 2019-2020
We tracked the trade-in price from either 1st January or the first available trade-in value from the smartphones release date through to 31st December. The majority of the highest depreciating devices are all phones that are 5+ years old, where trade-in stores price them low as the resale and demand are no longer there. For example, when looking at the iPhone in 1st, 2nd, and 4th place, they all were released 7-8 years ago and no longer supported the latest iOS updates, with the iPhone 5S ending on 12.4.1 and the iPhone 5/5C ending on 10.3.3.
- Samsung Galaxy A6 2018 accounts for 74% of all valuations on the site, however, it lost over -75.00% of its value in 2019
- Motorola is the only brand in the top 10 with 3 colossal depreciation declines from devices released in under 2 years. Motorola One, G7 Play & G7 Power
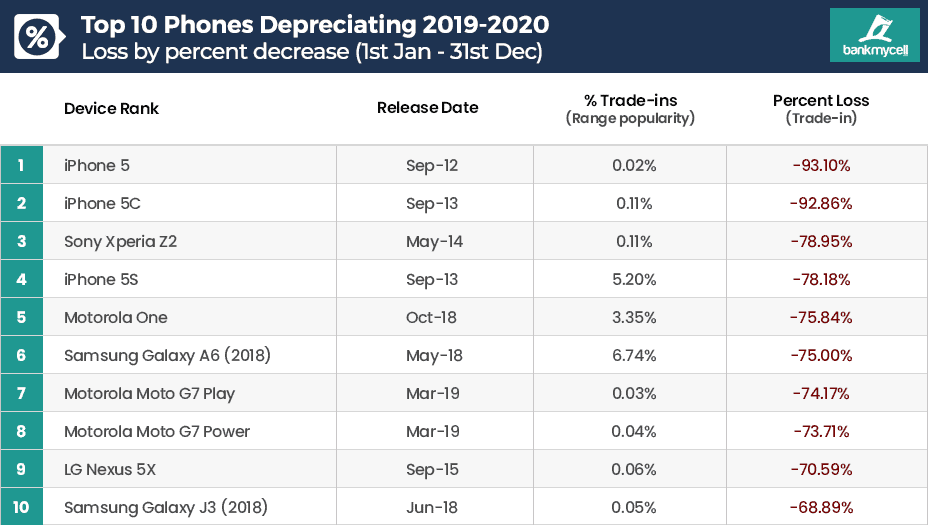
Data source: We ranked devices by the highest percentage loss from 01/01/19 to 12/31/19. Trade-in depreciation and value loss data is from the top price on multiple US buyback stores taking the ‘Good’ condition and showing averages from all storage capacities.
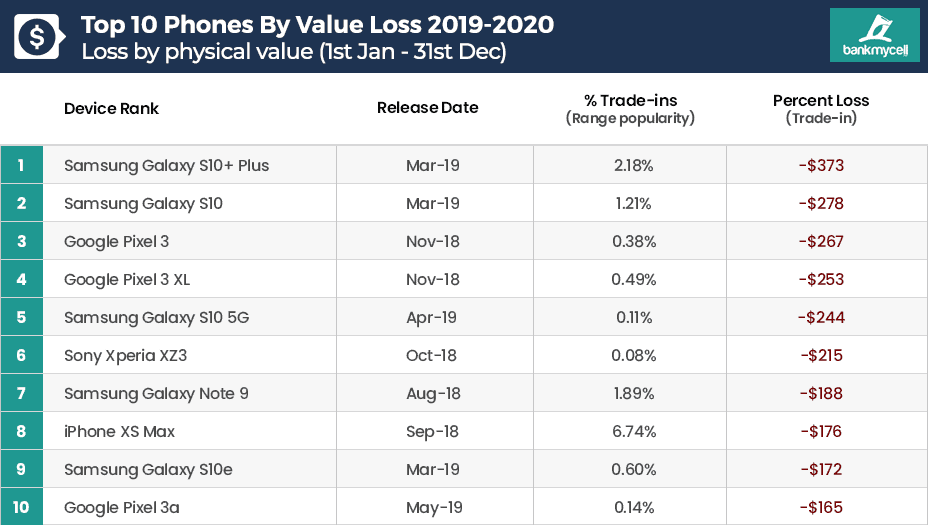
Phones losing the most resale value in 2019-2020
Again, we tracked the trade-in price from either 1st January or the first available trade-in value from the smartphone release date. As you can see from the data below, the most significant value losses come from flagship smartphones, of course. These sizable drops include Android devices such as the Galaxy S10 that were only released just before Q2, meaning phones like the S10+ lost almost $400 in 9 months.
- Devices on the Android OS were the only phones to lose $180 up to $373
- The Google Pixel 3 lost $267 (-56.70%) of its resale value after only being released in Nov-2018
- The Galaxy S10+ lost the most value in 2019, with -$373 dropping off its resale price.
Data source: We ranked devices by the highest value loss from 01/01/19 to 12/31/19. Trade-in depreciation and value loss data is from the top price on multiple US buyback stores taking the ‘Good’ condition and showing averages from all storage capacities.
New Devices Released In 2018-2019
Latest Smartphones & Their Depreciation
In the data that follows, we specifically look at how much trade-in value was lost or retained from devices that got released in 2018-2019.
2019 Releases: Early depreciation warnings
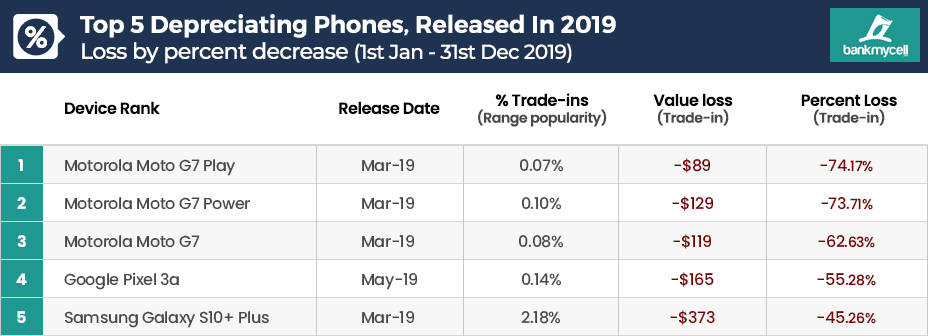
The data that follows is only shown to highlight emerging trends, due to the staggered 2019 release dates, not all phones had equal times to depreciate through a full 12 months. Earlier in the report, we mentioned how budget android devices trended with high depreciation in the first 1-2 years, as you can see the first 4 budget devices lost an insane amount of value in 9 months.
- Motorola G7 range depreciated the fastest, losing between -62.63% to -74.17% of its resale value in just over 9 months
- G7 Play ($199 new) lost $89, the G7 Power ($249 new) lost $129 and the G7 ($299 new) lost $119.
- The Samsung Galaxy S10+ lost a lot more at -45.26% compared to last year’s Galaxy S9+ at -30.21%.
- In 8 months following its release, the Google Pixel 3a lost 55.28% of its resale value.
Data source: We ranked devices released in 2019 by the highest percentage loss from 01/01/19 to 12/31/19. Trade-in depreciation and value loss data is from the top price on multiple US buyback stores taking the ‘Good’ condition and showing averages from all storage capacities.
2018 Releases: Phones with low 2019 depreciation
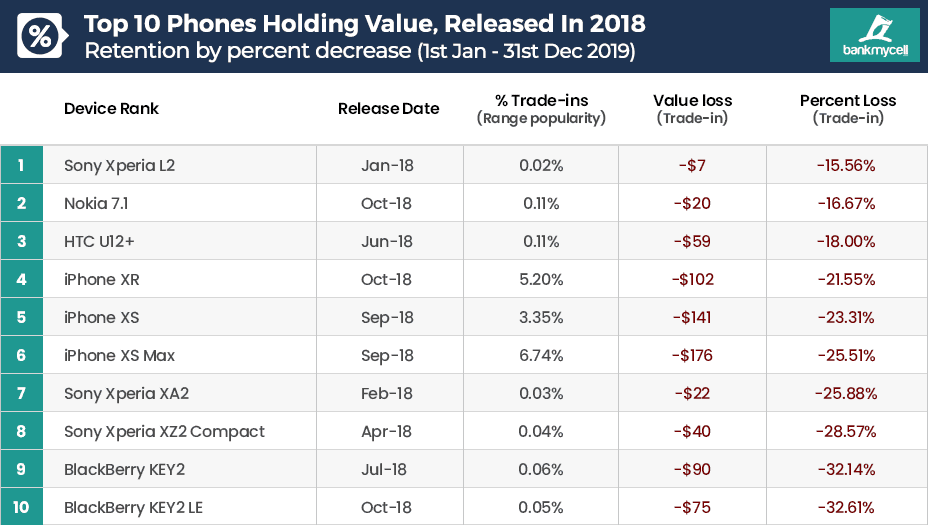
The trends below show the smartphone resale price drops in 2019 for devices ONLY released in the year before, 2018. Here we look at phones that have low trade-in depreciation in terms of a percentage basis, which, as you’ll see from the highlights below, isn’t necessarily always a good thing.
- The three iPhones released in 2018 make up 29% of trade-in on the site, and it’s no surprise as they only lost an average of 23.45% in 2019.
- The HTC U12+ and BlackBerry KEY2 range retained their trade-in prices well without taking a significant loss of value in 2018.
- All other phones took a massive hit in their first year of release, for example, the Sony Xperia L2 was released for $249 in Jan 2018 and only worth $45 in Jan-19, so its minimal loss in 2019-2020 isn’t so much of a win as the data below shows.
Data source: We ranked devices released in 2018 by the lowest percentage loss from 01/01/19 to 12/31/19. Trade-in depreciation and value loss data is from the top price on multiple US buyback stores taking the ‘Good’ condition and showing averages from all storage capacities.
2018 Releases: Phones with high 2019 depreciation
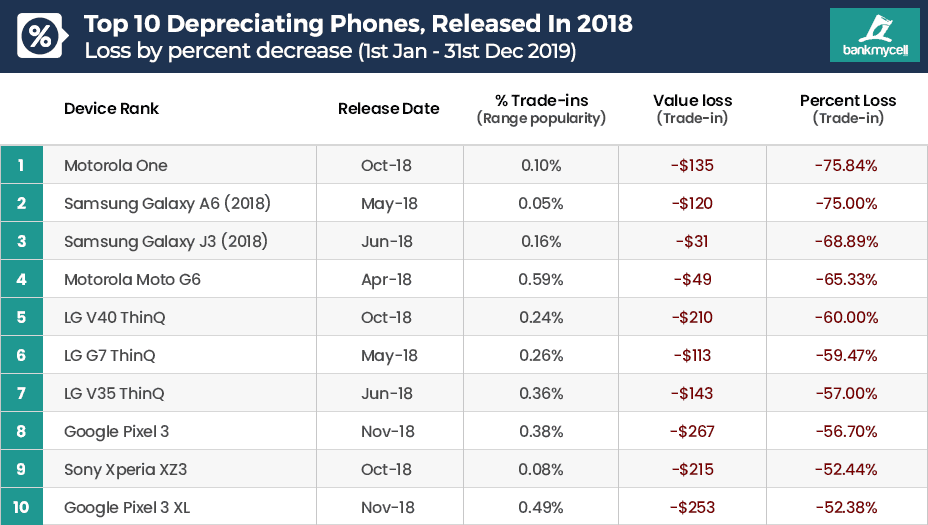
The trends below show the smartphone resale price drops in 2019 for devices ONLY released in the year before, 2018 (1-12 months earlier). Devices are ranked by the highest percentage loss.
- Android clears house in the top 10 depreciating phones of 2019 that got released in 2018, with losses ranging from –52.38% to -75.84%.
- The Google Pixel 3 took the most significant blow in physical value, losing –$267 on the entry model and -$353 on the Pixel XL in 2019-2020.
Data source: We ranked devices released in 2018 by the highest percentage loss from 01/01/19 to 12/31/19. Trade-in depreciation and value loss data is from the top price on multiple US buyback stores taking the ‘Good’ condition and showing averages from all storage capacities.
200+ Popular Phones Depreciation In 2019-2020
Winners And Losers
Sortable Sample Data
| BRAND | MODEL | RELEASE DATE | % TRADE-INS | START PRICE | END PRICE | DEPRECIATION |
|---|---|---|---|---|---|---|
| Apple | iPhone 5 16GB | 2012-08 | 0.60% | 22 | 2 | -90.91% |
| Apple | iPhone 5 32GB | 2012-09 | 0.47% | 31 | 2 | -93.55% |
| Apple | iPhone 5 64GB | 2012-09 | 0.44% | 34 | 2 | -94.12% |
| Apple | iPhone 5C 8GB | 2013-09 | 0.27% | 23 | 2 | -91.30% |
| Apple | iPhone 5C 16GB | 2013-09 | 0.29% | 28 | 2 | -92.86% |
| Apple | iPhone 5S 16GB | 2013-09 | 0.69% | 31 | 7 | -77.42% |
| Apple | iPhone 5C 32GB | 2013-09 | 0.25% | 33 | 2 | -93.94% |
| Apple | iPhone 5S 32GB | 2013-09 | 0.56% | 35 | 8 | -77.14% |
| Apple | iPhone 5S 64GB | 2013-09 | 0.51% | 44 | 9 | -79.55% |
| Apple | iPhone 6 32GB | 2014-09 | 1.28% | 66 | 47 | -28.79% |
| Apple | iPhone 6 16GB | 2014-09 | 1.43% | 85 | 47 | -44.71% |
| Apple | iPhone 6 64GB | 2014-09 | 1.22% | 92 | 59 | -35.87% |
| Apple | iPhone 6 Plus 32GB | 2014-09 | 0.44% | 98 | 76 | -22.45% |
| Apple | iPhone 6 128GB | 2014-09 | 1.13% | 113 | 62 | -45.13% |
| Apple | iPhone 6 Plus 16GB | 2014-09 | 0.51% | 117 | 82 | -29.91% |
| Apple | iPhone 6 Plus 64GB | 2014-09 | 0.46% | 133 | 97 | -27.07% |
| Apple | iPhone 6 Plus 128GB | 2014-09 | 0.43% | 142 | 113 | -20.42% |
| Apple | iPhone 6S 16GB | 2015-09 | 1.76% | 103 | 72 | -30.10% |
| Apple | iPhone 6S 32GB | 2015-09 | 1.74% | 112 | 74 | -33.93% |
| Apple | iPhone 6S 64GB | 2015-09 | 1.69% | 125 | 87 | -30.40% |
| Apple | iPhone 6S 128GB | 2015-09 | 1.55% | 130 | 97 | -25.38% |
| Apple | iPhone 6S Plus 32GB | 2015-09 | 0.95% | 161 | 109 | -32.30% |
| Apple | iPhone 6S Plus 16GB | 2015-09 | 0.99% | 163 | 102 | -37.42% |
| Apple | iPhone 6S Plus 64GB | 2015-09 | 0.96% | 188 | 116 | -38.30% |
| Apple | iPhone 6S Plus 128GB | 2015-09 | 0.89% | 203 | 128 | -36.95% |
| Apple | iPhone SE 16GB | 2016-03 | 0.51% | 72 | 47 | -34.72% |
| Apple | iPhone SE 32GB | 2016-03 | 0.51% | 77 | 53 | -31.17% |
| Apple | iPhone SE 64GB | 2016-03 | 0.47% | 92 | 62 | -32.61% |
| Apple | iPhone SE 128GB | 2016-03 | 0.44% | 104 | 72 | -30.77% |
| Apple | iPhone 7 32GB | 2016-09 | 2.00% | 186 | 113 | -39.25% |
| Apple | iPhone 7 128GB | 2016-09 | 1.77% | 206 | 128 | -37.86% |
| Apple | iPhone 7 256GB | 2016-09 | 1.59% | 226 | 141 | -37.61% |
| Apple | iPhone 7 Plus 32GB | 2016-09 | 1.85% | 262 | 190 | -27.48% |
| Apple | iPhone 7 Plus 128GB | 2016-09 | 1.81% | 283 | 195 | -31.10% |
| Apple | iPhone 7 Plus 256GB | 2016-09 | 1.61% | 292 | 210 | -28.08% |
| Apple | iPhone 8 64GB | 2017-09 | 1.46% | 296 | 201 | -32.09% |
| Apple | iPhone 8 256GB | 2017-09 | 1.24% | 361 | 235 | -34.90% |
| Apple | iPhone 8 Plus 64GB | 2017-09 | 1.87% | 400 | 283 | -29.25% |
| Apple | iPhone 8 Plus 256GB | 2017-09 | 1.60% | 422 | 328 | -22.27% |
| Apple | iPhone X 64GB | 2017-11 | 3.02% | 492 | 376 | -23.58% |
| Apple | iPhone X 256GB | 2017-11 | 2.94% | 536 | 375 | -30.04% |
| Apple | iPhone XS 64GB | 2018-09 | 1.18% | 555 | 431 | -22.34% |
| Apple | iPhone XS 256GB | 2018-09 | 1.12% | 605 | 469 | -22.48% |
| Apple | iPhone XS Max 64GB | 2018-09 | 2.29% | 650 | 484 | -25.54% |
| Apple | iPhone XS 512GB | 2018-09 | 1.06% | 655 | 492 | -24.89% |
| Apple | iPhone XS Max 256GB | 2018-09 | 2.26% | 690 | 514 | -25.51% |
| Apple | iPhone XS Max 512GB | 2018-09 | 2.19% | 730 | 544 | -25.48% |
| Apple | iPhone XR 64GB | 2018-10 | 1.89% | 450 | 329 | -26.89% |
| Apple | iPhone XR 128GB | 2018-10 | 1.67% | 460 | 384 | -16.52% |
| Apple | iPhone XR 256GB | 2018-10 | 1.64% | 510 | 401 | -21.37% |
| Apple | iPhone 11 128GB | 2019-09 | 0.51% | 550 | 440 | -20.00% |
| Apple | iPhone 11 256GB | 2019-09 | 0.51% | 730 | 490 | -32.88% |
| Apple | iPhone 11 64GB | 2019-09 | 0.51% | 500 | 405 | -19.00% |
| Apple | iPhone 11 Pro 256GB | 2019-09 | 0.15% | 760 | 685 | -9.87% |
| Apple | iPhone 11 Pro 512GB | 2019-09 | 0.15% | 830 | 740 | -10.84% |
| Apple | iPhone 11 Pro 64GB | 2019-09 | 0.15% | 680 | 615 | -9.56% |
| Apple | iPhone 11 Pro Max 256GB | 2019-09 | 0.26% | 810 | 770 | -4.94% |
| Apple | iPhone 11 Pro Max 512GB | 2019-09 | 0.26% | 890 | 810 | -8.99% |
| Apple | iPhone 11 Pro Max 64GB | 2019-09 | 0.26% | 730 | 690 | -5.48% |
| BlackBerry | BlackBerry Passport | 2014-09 | 0.07% | 60 | 45 | -25.00% |
| BlackBerry | BlackBerry KEYone | 2017-04 | 0.06% | 120 | 72 | -40.00% |
| BlackBerry | BlackBerry KEY2 | 2018-07 | 0.06% | 280 | 190 | -32.14% |
| BlackBerry | BlackBerry KEY2 LE | 2018-10 | 0.05% | 230 | 155 | -32.61% |
| Google Pixel 32GB | 2016-10 | 0.11% | 86 | 40 | -53.49% | |
| Google Pixel XL 32GB | 2016-10 | 0.12% | 101 | 58 | -42.57% | |
| Google Pixel 128GB | 2016-10 | 0.07% | 110 | 58 | -47.27% | |
| Google Pixel XL 128GB | 2016-10 | 0.10% | 125 | 67 | -46.40% | |
| Google Pixel 2 64GB | 2017-10 | 0.19% | 190 | 91 | -52.11% | |
| Google Pixel 2 128GB | 2017-10 | 0.12% | 210 | 106 | -49.52% | |
| Google Pixel 2 XL 64GB | 2017-10 | 0.32% | 232 | 105 | -54.74% | |
| Google Pixel 2 XL 128GB | 2017-10 | 0.21% | 247 | 125 | -49.39% | |
| Google Pixel 3 XL 64GB | 2018-11 | 0.25% | 440 | 220 | -50.00% | |
| Google Pixel 3 64GB | 2018-11 | 0.22% | 460 | 192 | -58.26% | |
| Google Pixel 3 128GB | 2018-11 | 0.16% | 480 | 215 | -55.21% | |
| Google Pixel 3 XL 128GB | 2018-11 | 0.23% | 526 | 240 | -54.37% | |
| Google Pixel 3a | 2019-05 | 0.07% | 280 | 116 | -58.57% | |
| Google Pixel 3a XL | 2019-05 | 0.07% | 317 | 151 | -52.37% | |
| HTC | HTC One Max | 2013-10 | 0.05% | 71 | 47 | -33.80% |
| HTC | HTC One M8s | 2014-03 | 0.04% | 20 | 16 | -20.00% |
| HTC | HTC One M8 16GB | 2014-03 | 0.11% | 25 | 16 | -36.00% |
| HTC | HTC One M8 32GB | 2014-03 | 0.11% | 25 | 18 | -28.00% |
| HTC | HTC Desire Eye | 2014-10 | 0.09% | 36 | 35 | -2.78% |
| HTC | HTC One M9 | 2015-03 | 0.06% | 42 | 33 | -21.43% |
| HTC | HTC 10 64GB | 2016-04 | 0.06% | 51 | 53 | 3.92% |
| HTC | HTC 10 32GB | 2016-04 | 0.08% | 70 | 53 | -24.29% |
| HTC | HTC Desire 10 Pro | 2016-09 | 0.03% | 70 | 41 | -41.43% |
| HTC | HTC U Play | 2017-02 | 0.01% | 60 | 46 | -23.33% |
| HTC | HTC U11 | 2017-05 | 0.06% | 160 | 81 | -49.38% |
| HTC | HTC U11 Life 32GB | 2017-12 | 0.02% | 100 | 55 | -45.00% |
| HTC | HTC U11 Life 64GB | 2017-12 | 0.02% | 100 | 55 | -45.00% |
| HTC | HTC One A9 | 2018-03 | 0.07% | 51 | 28 | -45.10% |
| HTC | HTC U12+ 64GB | 2018-06 | 0.06% | 320 | 264 | -17.50% |
| HTC | HTC U12+ 128GB | 2018-06 | 0.05% | 330 | 269 | -18.48% |
| LG | LG G Flex | 2013-11 | 0.09% | 42.5 | 30 | -29.41% |
| LG | LG G Flex 2 | 2015-01 | 0.07% | 63 | 41 | -34.92% |
| LG | LG G4 | 2015-04 | 0.36% | 38 | 15 | -60.53% |
| LG | LG Nexus 5X 16GB | 2015-09 | 0.04% | 50 | 15 | -70.00% |
| LG | LG Nexus 5X 32GB | 2015-09 | 0.04% | 52 | 15 | -71.15% |
| LG | LG V10 | 2015-10 | 0.10% | 46 | 26 | -43.48% |
| LG | LG G5 | 2016-02 | 0.17% | 53 | 22 | -58.49% |
| LG | LG G6 32GB | 2017-03 | 0.41% | 111 | 49 | -55.86% |
| LG | LG G6 64GB | 2017-03 | 0.29% | 111 | 54 | -51.35% |
| LG | LG V30 | 2017-09 | 0.54% | 211 | 66 | -68.72% |
| LG | LG V30 Plus | 2017-12 | 0.16% | 209 | 82 | -60.77% |
| LG | LG G7 ThinQ | 2018-05 | 0.26% | 190 | 77 | -59.47% |
| LG | LG V35 ThinQ 64GB | 2018-06 | 0.12% | 150 | 75 | -50.00% |
| LG | LG V40 ThinQ 64GB | 2018-10 | 0.24% | 350 | 140 | -60.00% |
| Motorola | Motorola Moto X2 | 2014-09 | 0.04% | 33 | 15 | -54.55% |
| Motorola | Motorola Nexus 6 32GB | 2014-11 | 0.10% | 53 | 33 | -37.74% |
| Motorola | Motorola Nexus 6 64GB | 2014-11 | 0.08% | 55 | 33 | -40.00% |
| Motorola | Motorola Moto Z2 Play 32GB | 2017-06 | 0.07% | 60 | 38 | -36.67% |
| Motorola | Motorola Moto Z2 Play 64GB | 2017-06 | 0.05% | 60 | 43 | -28.33% |
| Motorola | Motorola Moto Z2 Force 128GB | 2017-08 | 0.13% | 90 | 55 | -38.89% |
| Motorola | Motorola Moto Z2 Force 64GB | 2017-08 | 0.15% | 90 | 51 | -43.33% |
| Motorola | Motorola Moto X4 | 2017-10 | 0.25% | 90 | 45 | -50.00% |
| Motorola | Motorola Moto G6 32GB | 2018-04 | 0.32% | 75 | 25 | -66.67% |
| Motorola | Motorola Moto G6 64GB | 2018-04 | 0.27% | 75 | 27 | -64.00% |
| Motorola | Motorola One | 2018-10 | 0.10% | 178 | 43 | -75.84% |
| Motorola | Motorola Moto G7 | 2019-03 | 0.08% | 190 | 71 | -62.63% |
| Motorola | Motorola Moto G7 Play | 2019-03 | 0.07% | 120 | 31 | -74.17% |
| Motorola | Motorola Moto G7 Power | 2019-03 | 0.10% | 175 | 46 | -73.71% |
| Nokia | Nokia 808 Pureview | 2012-09 | 0.03% | 26.5 | 20 | -24.53% |
| Nokia | Nokia Lumia 1020 | 2013-02 | 0.08% | 20 | 20 | 0.00% |
| Nokia | Nokia 6 (2017) | 2017-01 | 0.00% | 50 | 42 | -16.00% |
| Nokia | Nokia 8 (2017) | 2017-09 | 0.00% | 105 | 82 | -21.90% |
| Nokia | Nokia 7 Plus | 2018-02 | 0.05% | 120 | 71 | -40.83% |
| Nokia | Nokia 6 32GB (2018) | 2018-04 | 0.10% | 90 | 53 | -41.11% |
| Nokia | Nokia 6 64GB (2018) | 2018-04 | 0.08% | 96 | 53 | -44.79% |
| Nokia | Nokia 7.1 | 2018-10 | 0.11% | 120 | 100 | -16.67% |
| Samsung | Samsung Galaxy Note 2 16GB | 2012-02 | 0.02% | 29 | 29 | 0.00% |
| Samsung | Samsung Galaxy Note 2 32GB | 2012-08 | 0.01% | 34 | 34 | 0.00% |
| Samsung | Samsung Galaxy Note 2 64GB | 2012-08 | 0.01% | 36 | 36 | 0.00% |
| Samsung | Samsung Galaxy S4 16GB | 2013-03 | 0.23% | 28 | 17 | -39.29% |
| Samsung | Samsung Galaxy S4 32GB | 2013-03 | 0.17% | 30 | 21 | -30.00% |
| Samsung | Samsung Galaxy S4 64GB | 2013-03 | 0.15% | 32 | 26 | -18.75% |
| Samsung | Samsung Galaxy S4 Zoom | 2013-07 | 0.08% | 38 | 38 | 0.00% |
| Samsung | Samsung Galaxy Note 3 16GB | 2013-09 | 0.14% | 44 | 41 | -6.82% |
| Samsung | Samsung Galaxy Note 3 32GB | 2013-09 | 0.10% | 46 | 42 | -8.70% |
| Samsung | Samsung Galaxy Note 3 64GB | 2013-09 | 0.09% | 48 | 42 | -12.50% |
| Samsung | Samsung Galaxy S5 Active | 2014-05 | 0.04% | 44 | 44 | 0.00% |
| Samsung | Samsung Galaxy S5 16GB | 2014-05 | 0.35% | 44 | 24 | -45.45% |
| Samsung | Samsung Galaxy S5 32GB | 2014-05 | 0.28% | 44 | 29 | -34.09% |
| Samsung | Samsung Galaxy S5 Duos | 2014-06 | 0.04% | 44 | 44 | 0.00% |
| Samsung | Samsung Galaxy S5 Mini | 2014-07 | 0.05% | 37 | 37 | 0.00% |
| Samsung | Samsung Galaxy Note 4 | 2014-10 | 0.20% | 69 | 54 | -21.74% |
| Samsung | Samsung Galaxy Note Edge 32GB | 2014-11 | 0.05% | 91 | 81 | -10.99% |
| Samsung | Samsung Galaxy Note Edge 64GB | 2014-11 | 0.04% | 91 | 82 | -9.89% |
| Samsung | Samsung Galaxy A5 | 2014-12 | 0.09% | 30 | 30 | 0.00% |
| Samsung | Samsung Galaxy S6 32GB | 2015-03 | 0.39% | 74 | 44 | -40.54% |
| Samsung | Samsung Galaxy S6 128GB | 2015-03 | 0.23% | 79 | 58 | -26.58% |
| Samsung | Samsung Galaxy S6 64GB | 2015-03 | 0.28% | 82 | 52 | -36.59% |
| Samsung | Samsung Galaxy S6 Edge 32GB | 2015-03 | 0.15% | 88 | 58 | -34.09% |
| Samsung | Samsung Galaxy S6 Edge 64GB | 2015-03 | 0.11% | 98 | 58 | -40.82% |
| Samsung | Samsung Galaxy S6 Edge 128GB | 2015-03 | 0.09% | 107 | 61 | -42.99% |
| Samsung | Samsung Galaxy S6 Active | 2015-06 | 0.11% | 56 | 36 | -35.71% |
| Samsung | Samsung Galaxy S6 Edge+ 32GB | 2015-08 | 0.16% | 92 | 61 | -33.70% |
| Samsung | Samsung Galaxy Note 5 32GB | 2015-08 | 0.32% | 101 | 73 | -27.72% |
| Samsung | Samsung Galaxy S6 Edge+ 64GB | 2015-08 | 0.13% | 102 | 68 | -33.33% |
| Samsung | Samsung Galaxy Note 5 128GB | 2015-08 | 0.22% | 104 | 84 | -19.23% |
| Samsung | Samsung Galaxy Note 5 64GB | 2015-08 | 0.24% | 104 | 81 | -22.12% |
| Samsung | Samsung Galaxy S7 128GB | 2016-03 | 0.52% | 85 | 35 | -58.82% |
| Samsung | Samsung Galaxy S7 32GB | 2016-03 | 0.91% | 101 | 55 | -45.54% |
| Samsung | Samsung Galaxy S7 64GB | 2016-03 | 0.61% | 101 | 56 | -44.55% |
| Samsung | Samsung Galaxy S7 Edge 32GB | 2016-03 | 0.78% | 114 | 50 | -56.14% |
| Samsung | Samsung Galaxy S7 Edge 64GB | 2016-03 | 0.42% | 120 | 72 | -40.00% |
| Samsung | Samsung Galaxy S7 Edge 128GB | 2016-03 | 0.42% | 130 | 72 | -44.62% |
| Samsung | Samsung Galaxy J5 (2016) | 2016-04 | 0.14% | 40 | 40 | 0.00% |
| Samsung | Samsung Galaxy A7 (2016) | 2016-04 | 0.06% | 65 | 65 | 0.00% |
| Samsung | Samsung Galaxy A5 (2016) | 2016-05 | 0.09% | 40 | 40 | 0.00% |
| Samsung | Samsung Galaxy S7 Active | 2016-06 | 0.18% | 80 | 51 | -36.25% |
| Samsung | Samsung Galaxy A8 (2016) | 2016-10 | 0.04% | 90 | 90 | 0.00% |
| Samsung | Samsung Galaxy A3 (2017) | 2017-01 | 0.05% | 80 | 65 | -18.75% |
| Samsung | Samsung Galaxy A7 (2017) | 2017-01 | 0.06% | 85 | 85 | 0.00% |
| Samsung | Samsung Galaxy S8+ Plus 64GB | 2017-03 | 0.91% | 225 | 135 | -40.00% |
| Samsung | Samsung Galaxy S8 64GB | 2017-04 | 1.21% | 181 | 114 | -37.02% |
| Samsung | Samsung Galaxy S8 128GB | 2017-04 | 0.71% | 196 | 112 | -42.86% |
| Samsung | Samsung Galaxy J3 (2017) | 2017-06 | 0.24% | 25 | 19 | -24.00% |
| Samsung | Samsung Galaxy J7 (2017) | 2017-07 | 0.72% | 50 | 30 | -40.00% |
| Samsung | Samsung Galaxy J5 (2017) | 2017-07 | 0.00% | 70 | 70 | 0.00% |
| Samsung | Samsung Galaxy S8 Active | 2017-08 | 0.41% | 170 | 131 | -22.94% |
| Samsung | Samsung Galaxy Note 8 64GB | 2017-09 | 0.80% | 255 | 167 | -34.51% |
| Samsung | Samsung Galaxy Note 8 128GB | 2017-09 | 0.58% | 262 | 168 | -35.88% |
| Samsung | Samsung Galaxy Note 8 256GB | 2017-09 | 0.52% | 262 | 170 | -35.11% |
| Samsung | Samsung Galaxy A8 32GB (2018) | 2018-01 | 0.15% | 110 | 110 | 0.00% |
| Samsung | Samsung Galaxy A8 64GB (2018) | 2018-01 | 0.13% | 110 | 110 | 0.00% |
| Samsung | Samsung Galaxy S9 128GB | 2018-03 | 0.60% | 290 | 182 | -37.24% |
| Samsung | Samsung Galaxy S9 256GB | 2018-03 | 0.58% | 290 | 192 | -33.79% |
| Samsung | Samsung Galaxy S9 64GB | 2018-03 | 0.88% | 290 | 170 | -41.38% |
| Samsung | Samsung Galaxy S9+ Plus 128GB | 2018-03 | 0.56% | 326 | 192 | -41.10% |
| Samsung | Samsung Galaxy S9+ Plus 256GB | 2018-03 | 0.51% | 326 | 213 | -34.66% |
| Samsung | Samsung Galaxy S9+ Plus 64GB | 2018-03 | 0.79% | 326 | 192 | -41.10% |
| Samsung | Samsung Galaxy A6 (2018) | 2018-05 | 0.05% | 160 | 40 | -75.00% |
| Samsung | Samsung Galaxy J3 (2018) | 2018-06 | 0.16% | 45 | 14 | -68.89% |
| Samsung | Samsung Galaxy Note 9 128GB | 2018-08 | 1.06% | 408 | 267 | -34.56% |
| Samsung | Samsung Galaxy Note 9 512GB | 2018-08 | 0.83% | 556 | 321 | -42.27% |
| Samsung | Samsung Galaxy S10 128GB | 2019-03 | 0.82% | 590 | 332 | -43.73% |
| Samsung | Samsung Galaxy S10 512GB | 2019-03 | 0.39% | 680 | 382 | -43.82% |
| Samsung | Samsung Galaxy S10+ Plus 128GB | 2019-03 | 0.96% | 690 | 388 | -43.77% |
| Samsung | Samsung Galaxy S10+ Plus 1TB | 2019-03 | 0.62% | 950 | 517 | -45.58% |
| Samsung | Samsung Galaxy S10+ Plus 512GB | 2019-03 | 0.60% | 830 | 447 | -46.14% |
| Samsung | Samsung Galaxy S10e 128GB | 2019-03 | 0.40% | 463 | 262 | -43.41% |
| Samsung | Samsung Galaxy S10e 256GB | 2019-03 | 0.21% | 440 | 298 | -32.27% |
| Samsung | Samsung Galaxy S10 5G 256GB | 2019-04 | 0.05% | 645 | 431 | -33.18% |
| Samsung | Samsung Galaxy S10 5G 512GB | 2019-04 | 0.05% | 748 | 475 | -36.50% |
| Samsung | Samsung Galaxy Note 10+ 5G 256GB | 2019-08 | 0.07% | 668 | 630 | -5.69% |
| Samsung | Samsung Galaxy Note 10 256GB | 2019-08 | 0.16% | 525 | 467 | -11.05% |
| Samsung | Samsung Galaxy Note 10+ 256GB | 2019-08 | 0.24% | 570 | 535 | -6.14% |
| Samsung | Samsung Galaxy Note 10+ 512GB | 2019-08 | 0.24% | 615 | 572 | -6.99% |
| Sony | Sony Xperia Z2 | 2014-05 | 0.05% | 47.5 | 10 | -78.95% |
| Sony | Sony Xperia Z3 Compact | 2014-09 | 0.03% | 40 | 17 | -57.50% |
| Sony | Sony Xperia Z3 | 2014-09 | 0.05% | 50.5 | 30 | -40.59% |
| Sony | Sony Xperia Z3+ | 2015-06 | 0.02% | 38 | 18 | -52.63% |
| Sony | Sony Xperia Z5 | 2015-10 | 0.00% | 55 | 53 | -3.64% |
| Sony | Sony Xperia Z5 Compact | 2015-10 | 0.00% | 60 | 50 | -16.67% |
| Sony | Sony Xperia X | 2016-05 | 0.04% | 50 | 39 | -22.00% |
| Sony | Sony Xperia XA Ultra 16GB | 2016-07 | 0.03% | 35 | 25 | -28.57% |
| Sony | Sony Xperia XA Ultra 32GB | 2016-07 | 0.03% | 35 | 25 | -28.57% |
| Sony | Sony Xperia L2 | 2018-01 | 0.02% | 45 | 38 | -15.56% |
| Sony | Sony Xperia XA2 | 2018-02 | 0.03% | 85 | 63 | -25.88% |
| Sony | Sony Xperia XA2 Ultra | 2018-02 | 0.05% | 112 | 70 | -37.50% |
| Sony | Sony Xperia XZ2 Compact | 2018-04 | 0.04% | 140 | 100 | -28.57% |
| Sony | Sony Xperia XZ2 | 2018-04 | 0.06% | 190 | 110 | -42.11% |
| Sony | Sony Xperia XZ2 Premium | 2018-07 | 0.06% | 280 | 140 | -50.00% |
| Sony | Sony Xperia XZ3 | 2018-10 | 0.08% | 410 | 195 | -52.44% |
Depreciation Data Explained
2019-2020 Specific Data Methodology
- The depreciation data displayed is for the online trade-in market in 2019-2020, where a price got quoted for ‘Good’ condition, and the top quote available from all store pricing feeds.
- The initial figure is the first available trade-in price for a phone in 2019; the final figure is the latest available price for a phone in 12/31/2019.
- Depreciation is measured by a percentage decrease calculation of those figures, value loss is from the initial 2019 figure until 12/31/2019.
- Flagship OS data contains all devices under the corresponding operating system that is valued over $700. Budget Android OS data contains all android devices valued at $350 and under.
- On parent device names that have different storage capacities, all prices are calculated as an average.
- This is not a depreciation decrease from the device’s initial launch (unless specifically mentioned within the content).
Today’s Phone Trade-In Prices
To get an idea of the values you can get when selling your old phone in the US, check out our main website:


