2020-2021's Phone Depreciation Report
Best Vs. Worst: Devices, Brands & Operating Systems
Depreciation Report Introduction
Most consumers rely on trade-in services to offset the ever-increasing price of new smartphones, and through 2020-2021 this has never been so essential in the upgrade process. After all, in 2010, the price of a flagship device like the iPhone 4 was around $599. By comparison, today the latest top of the range iPhone 12 Pro Max will cost you $1,399 (and some phones like the Galaxy Fold retailed for $1,999).
Through Jan 1st – Dec 31st in 2020, cell phone trade-in website, BankMyCell, recorded buyback values from 310 popular phones hourly. Our annual trade-in market report uncovers which brands, operating systems, and particular smartphone series burn consumers’ cash the fastest!
Report Quick Links
Consumer-Focused Report Summary
Top 6 Standout Price Drop Discoveries
Flagship Android Devices Lose Value Twice As Fast As iOS (Years 1-2)
The data below quotes the trade-in depreciation from the initial buyback price for a used iOS or Android device priced at $700 or over, then tracks its decline yearly:
- In one year, the current average depreciation of a new iPhone’s trade-in value is -16.70%, compared with Android’s -33.62%.
- In two years, the current average depreciation of a new iPhone’s trade-in value is -35.47% compared with Android’s -61.50%.
- After four years, the gap begins to close, with iPhones losing an average of -66.43% of their initial buyback value, compared with Androids -81.11%.
Learn More: Jump to data
If we were to look at the depreciation from the devices launch day price, brand new and in a box, not the initial trade-in value above, the data is much more shocking:
- 9 months after the Samsung Galaxy S20 Ultra release, the buyback price was -64.71% of its original retail value.
- By comparison, in the same nine-month timespan from release, the iPhone 11 Pro Max had lost -32.22% from its original retail value.
Important: Our data excludes limited-time trade-in or upgrade promo campaigns from brands and carriers.
iPhone 11 vs. Galaxy S20 Buyback Prices (Early Warning)

The iPhone 11 range equates to 12.35% of all the trade-ins going through the site in 2020. With the year one iOS vs. Android data, it only makes sense to compare Samsung’s rival flagship, the Galaxy S20 range, head to head in price retention:
- iPhone 11 lost -12.84% of its trade-in value in the whole of 2020, compared with the Galaxy S20 losing -34.73% in only nine months.
- iPhone 11 Pro lost -21.31% of its trade-in value throughout 2020, compared with the Galaxy S20+ losing -30.59% in only nine months.
- iPhone 11 Pro Max lost -15.96% of its trade-in value in the whole of 2020, compared with the Galaxy S20 Ultra losing -36.30% in only nine months.
Important: Our data excludes limited-time trade-in or upgrade promo campaigns from brands and carriers.
Budget Android Devices Lose An Average Of -52.61% In Year One

By tracking Android smartphones that retailed at $350 or less, we mapped the aggressive declines in buyback values in as early as one year. You might want to take a seat if you own one of these devices.
- Budget Android devices retailing for $350 or less will lose an average of -52.61% of their resale value in year one, -73.61% year two, -85.15% year three, and -94.90% by year four.
- One popular example, the Samsung A50 lost -79.94% of its trade-in value from March 2019 to December 2020.
- Another example is the Motorola G7 range, which lost up to -79.17% of their trade-in value in 9 months in 2019, then a further -61.97% between Jan-Dec 2020.
Learn More: Jump to data
Important: Our data excludes limited-time trade-in or upgrade promo campaigns from brands and carriers.
Apple's Black Swan: iPhone SE 2020 Resale Value Plummets in 8 Months.

It wasn’t all sunshine and roses for Apple, the iPhone SE 2020 did not follow the -16.70% average decline in year one. Like the trends budget Android devices follow, its loss from the initial trade-in value in April 2020 was much more aggressive.
The iPhone SE 2020 lost an average of -38.32% of its resale price eight months:
- iPhone SE 2020 (64GB) retailed for $399, had an initial ‘used’ buyback price for $290, and ended the year on $175 (-39.66%)
- iPhone SE 2020 (128GB) retailed for $449, had an initial ‘used’ buyback price for $350, and ended the year on $220 (-37.14%)
- iPhone SE 2020 (256GB) retailed for $549, had an initial ‘used’ buyback price for $380, and ended the year on $235 (-37.14%)
Important: Our data excludes limited-time trade-in or upgrade promo campaigns from brands and carriers.
Google Pixel 4 Lost -37.35% Trade-In Value & -70.04% Of Its Retail In One Year

Google Pixel phones appeared in a lot of report lists we ran, in particular, both the highest depreciation by price AND percentage. Consumers who owned one of the top 10 most traded-in Google Pixel phones in 2020 lost an average of -40.17% of the device’s value in 12 months.
- In 2020, the average trade-in depreciation of all Google Pixel phones was -38.46% across all models and storage sizes.
- Google’s Pixel 4 & 4 XL devices lost $154-$163, which is considerable with their initial trade-in values ranging between $380 to $490 in Jan 2020
- As well as making the overall highest value loss list, 2019’s Google Pixel 4 & 4 XL made the top 10 highest depreciation list too, -40.06% Pixel 4, -34.64% Pixel 4 XL.
Learn More: Jump to data
Important: Our data excludes limited-time trade-in or upgrade promo campaigns from brands and carriers.
Upgrade Shock: Motorola, HTC & Sony Worst Phones For Price Retention
We tracked 310 phone’s depreciation across nine popular phone brands to see which lost the most in 2020. According to the data, the three brands who’s device lost the highest percentage are as follows:
- #1 – HTC smartphone trade-in prices depreciated -53.08% on average between Jan – Dec 2020. The HTC U11 Life (2017) was the highest, depreciating at -81.82%.
- #2 – Motorola smartphone trade-in prices depreciated -42.57% on average between Jan – Dec 2020. The Motorola G7 (2019) was the highest, depreciating at -61.97%.
- #3 – Sony smartphone trade-in prices depreciated -39.51% on average between Jan – Dec 2020. The Sony Xperia XA2 (2018) was the highest, depreciating at -72.22%
Learn More: Jump to data
Important: Our data excludes limited-time trade-in or upgrade promo campaigns from brands and carriers.
iOS vs. Android Depreciation Rates
Price Drops by Operating System (4-Years)
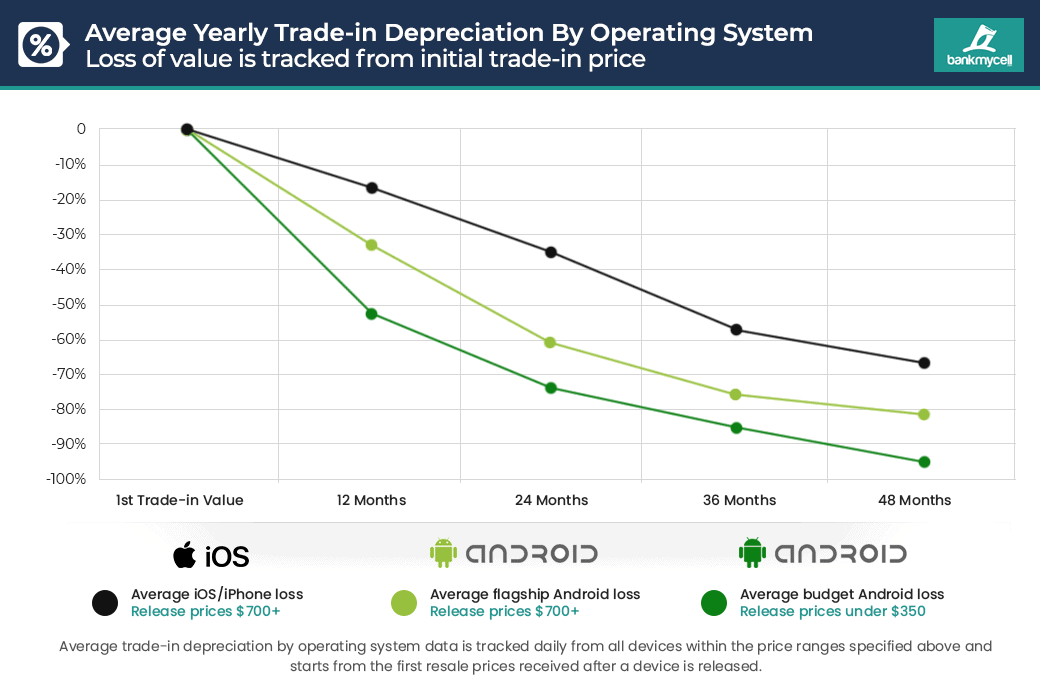
The data chart below shows the average yearly depreciation of flagship iOS and Android devices priced at $700 or over at release. As a comparison, we also included budget Android devices releasing at $350 or below. Phone price declines were recorded hourly on over 300 phones from their initial trade-in value through multiple online buyback vendors.
As the steady decline in the chart illustrates, consumers opting for iPhones will have a reasonably comfortable return on their device, with 12-24 months being the sweet spot. Owners of flagship Android devices take a much more considerable hit, while consumers with budget Android devices may want to turn away now.
iOS vs. Android: Average 4-year trade-in depreciation
According to the pricing data we receive:
- iOS 2020: iPhone’s (iOS) will currently lose an average of -16.70% of their trade-in value in the first year, with year-over-year losses ranging between -16.70% and -33.62% over four years.
- Android 2020: Android flagship devices depreciate twice as fast, losing an average of -33.21% trade-in value in year one; our data suggests iPhones tend to lose a similar value of -35.47% by year two.
- Android 2020: Android flagship devices lose value fast in the first few years, with -61.50% of their buyback price disappearing by year two and -75.42% by year three.
- Android 2020: In addition, Android devices cleared house in the top 10 depreciating 1-2-year-old phones list with losses ranging from –27.11% to -61.97%.
- Budget Android 2020: Take a breath… budget Android devices retailing for $350 or less will lose an average of -52.61% of their resale value in the first 12 months.
The total average 4-year depreciation from their original trade-in prices are:
- iOS/iPhones will lose an average of -66.43% of their initial buyback value.
- Android phones will lose an average of -81.11% of their initial buyback value.
- Budget Android phones will lose an average of -94.90% of their initial buyback value.
Data source: The average yearly depreciation figures above depict the initial highest trade-in value, then map its decline over 4 years within the specific OS release price bands. We used the best trade-in value from multiple buyback stores from eligible devices marked as ‘good’ condition (for natural wear and tear estimates). Our data excludes limited-time trade-in or upgrade promo campaigns from brands and carriers.
iPhone Buyback Value Depreciation (Example)
Using the data’s averages, if a consumer’s iPhone was valued at $850 for trade-in on day one, this is what it’s price decline would look like year-over-year.
| # | DAY 1 TRADE IN VALUE | YEAR 1 | YEAR 2 | YEAR 3 | YEAR 4 |
|---|---|---|---|---|---|
| Trade in Value | $850 | $708.02 | $548.52 | $364.11 | $285.31 |
| Value Loss | 0 | -$142 | -$159 | -$184 | -$79 |
| Avg. Year % Loss | 0 | -16.70% | -22.53% | -33.62% | -21.64% |
| Total % Depreciation | 0 | -16.70% | -35.47% | -57.16% | -66.43% |
Flagship Android Buyback Value Depreciation (Example)
Using the data’s averages, if a consumer’s Android phone was valued at $850 for trade-in on day one, this is what it’s price decline would look like year-over-year.
| # | DAY 1 TRADE IN VALUE | YEAR 1 | YEAR 2 | YEAR 3 | YEAR 4 |
|---|---|---|---|---|---|
| Trade in Value | $850 | $567.73 | $327.28 | $208.92 | $160.58 |
| Value Loss | 0 | -$282 | -$240 | -$118 | -$48 |
| Avg. Year % Loss | 0 | -33.21% | -42.35% | -36.16% | -23.14% |
| Total % Depreciation | 0 | -33.21% | -61.50% | -75.42% | -81.11% |
Budget Android Buyback Value Depreciation (Example)
Using the data’s averages, if a consumer’s budget Android device was valued at $205 for trade-in on day one, this is what it’s price decline would look like year-over-year.
| # | DAY 1 TRADE IN VALUE | YEAR 1 | YEAR 2 | YEAR 3 | YEAR 4 |
|---|---|---|---|---|---|
| Trade in Value | $205.00 | $97.16 | $53.97 | $30.44 | $10.46 |
| Value Loss | 0 | -$108 | -$43 | -$24 | -$20 |
| Avg. Year % Loss | 0 | -52.61% | -44.45% | -43.60% | -65.64% |
| Total % Depreciation | 0 | -52.61% | -73.67% | -85.15% | -94.90% |
Cell Phone Brand Depreciation
Phone Manufacturer Price Drops 2020-2021
When grouping the average depreciation by smartphone manufacturer, the data below will help illustrate to consumers which brands had excellent price retention in 2020-2021.
If you own a flagship HTC smartphone from the Desire or U series, you better take a seat; the average loss was -53.08% in 2020. Consumers owning Motorola, Sony Xperia, and Google Pixel phones should also be mindful of aggressive price declines.
Average Smartphone Depreciation By Brand (2020-2021)
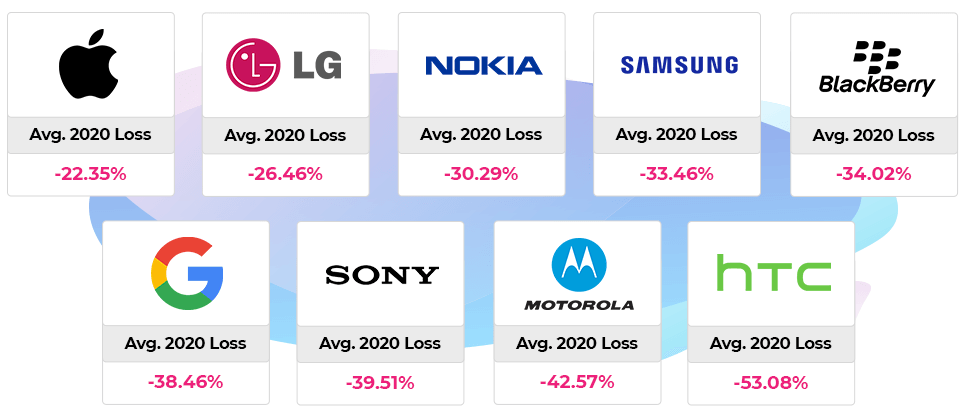
Ranked Least to Highest Depreciation:
- iPhone trade-in price drops averaged -22.35% in 2020-2021.
- LG trade-in price drops averaged -26.46% in 2020-2021.
- Nokia trade-in price drops averaged -30.29% in 2020-2021.
- Samsung trade-in price drops averaged -33.46% in 2020-2021.
- BlackBerry trade-in price drops averaged -34.02% in 2020-2021.
- Google Pixel trade-in price drops averaged -38.46% in 2020-2021.
- Sony Xperia trade-in price drops averaged -39.51% in 2020-2021.
- Motorola trade-in price drops averaged -42.57% in 2020-2021.
- HTC trade-in price drops averaged -53.08% in 2020-2021.
Data source: Average cell phone brand depreciation rates were measured from the best available ‘good’ condition trade-in value from multiple buyback stores. The data sample (01/01/2020 to 12/31/2020) comes from 300+ devices, including storage capacity-specific quotes. Our data excludes limited-time trade-in or upgrade promo campaigns from brands and carriers.
iPhone Depreciation (2020-2021)
Price Drops By Popular Trade-ins & Report Highlights
Below, we look at the most popular phones people are resold over the last year. The brand-specific data shows the individual handset depreciation, value loss, and the percentage of trade-ins across key smartphone brands.
Below, we’ve ranked the most popular Apple iPhones via buyback popularity, showing 12-month iPhone depreciation rates and value loss.
- Consumers who owned one of the top 10 most traded-in iPhones in 2020 only lost an average of -14.24% of the device value in 12 months (-3.80% to -24.68%).
- The iPhone 11 Pro Max is holding firm; it lost -15.96% in 2020 but -18.77% in total since its launch ($810 to $658 from Sept-19 to Dec-20).
- The iPhone 11 wasn’t as successful; it lost -12.84% in 2020 but -25.80% in total when including a sharper post-launch drop in Sept-Dec 2019.
- 2015’s iPhone 6S had the highest depreciation rate in 2020, losing -24.68% of its value, whereas the iPhone 7 Plus owners only lost -3.80% as it’s relatively low value plateaued.
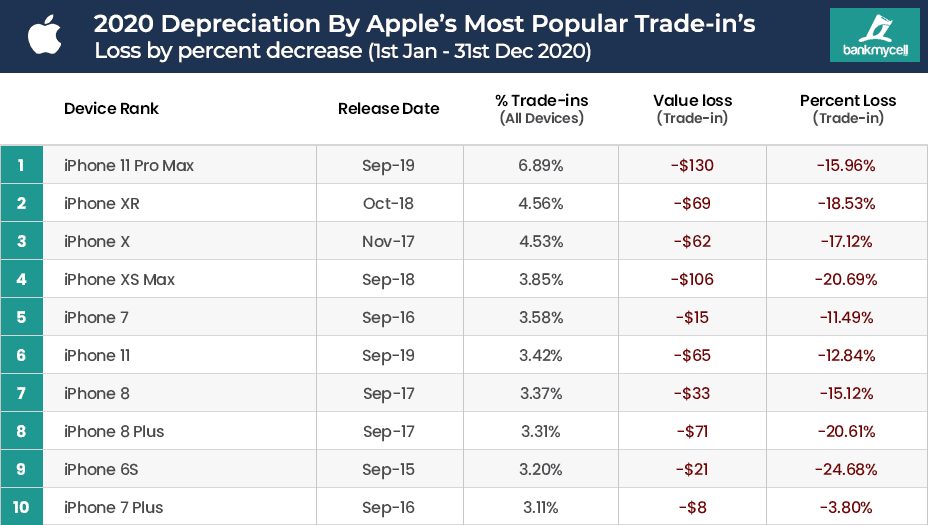
Data source: Apple iPhones are ranked by trade-in popularity from 01/01/2020 to 12/31/2020, showing the top ‘good’ condition trade-in value across multiple buyback stores. Depreciation and value loss figures are averages across storage capacity specific quotes. Our data excludes limited-time trade-in or upgrade promo campaigns from brands and carriers.
iPhone Depreciation Highlights
Ignoring the top 10 trade-in popularity, below are any standout data points from the brand’s depreciation.
- Following the trend of budget Android devices, the iPhone SE 2020 lost a much higher -38.32% of its original $340 trade-in value in 8 short months following its release. Well over double the -16.70% average depreciation in year one for new iPhones.
- The original iPhone SE also took an aggressive -33.32% loss in value through 2020.
- By the turn of 2022, we expect the iPhone 5, 5S, and 5C will no longer have any trade-in value as their all resale prices plummeted below $20.
Samsung Depreciation (2020-2021)
Price Drops By Popular Trade-ins & Report Highlights
Below, we’ve ranked the most popular Samsung Galaxy phones via buyback popularity, showing 12-month Samsung phone depreciation rates and value loss.
- Consumers who owned one of the top 10 most traded-in Samsung phones in 2020 lost an average of -13.64% of the device’s value in 12 months (-8.10% to -19.17%)*
- Out of the top 10, 2019’s Samsung Galaxy Note 10+ lost the highest value in 2020 at -$83, although it was only -15.68% of the device’s original value in Jan 2020.*
- Out of the top 10, 2017’s Samsung Galaxy Note 8 had the highest depreciation, losing -19.17% of its value.*
*Important: Low 2020 depreciation rates don’t necessarily mean devices have held value, as per our 4-year android loss chart, many Android devices lose value heavily in the first 1-2 years.
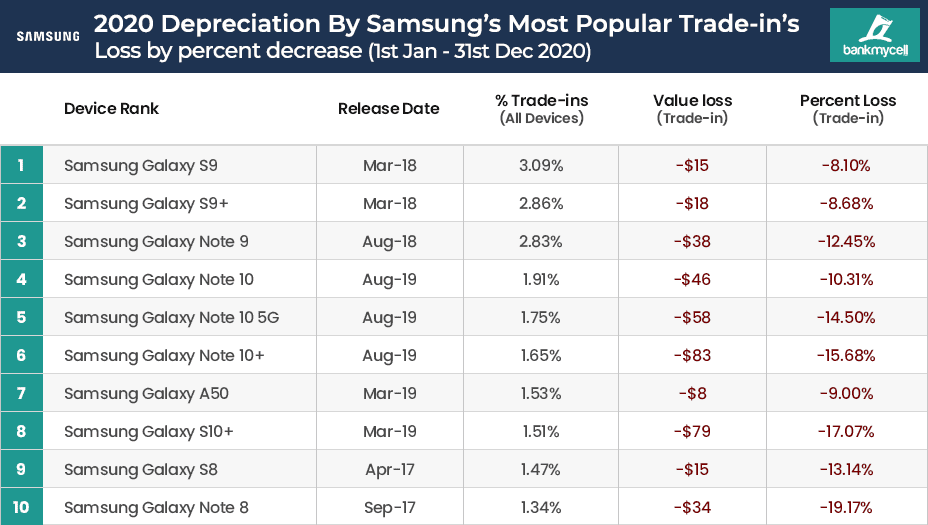
Data source: Samsung phones are ranked by trade-in popularity from 01/01/2020 to 12/31/2020, showing the top ‘good’ condition trade-in value across multiple buyback stores. Depreciation and value loss figures are averages across storage capacity specific quotes. Our data excludes limited-time trade-in or upgrade promo campaigns from brands and carriers.
Samsung Depreciation Highlights
Ignoring the top 10 trade-in popularity, below are any standout data points from the brand’s depreciation.
- Galaxy S10: The Samsung Galaxy S10 lost -43.78% between Mar-Dec 2019, which isn’t great for consumers. However, as this chart shows, anyone upgrading after a year’s ownership can see the worst is over (-13.54% in 2020).
- Galaxy S20: The Samsung Galaxy S20 range lost -33.87% since launching in March 2020. The Galaxy S20 lost $197 / -34.73%, S20+ lost $204 / -30.59%, and the S20 Ultra lost $302 / -36.30%
- Galaxy Note: The Samsung Galaxy Note 10 has only lost -25.30% since launch, and the -10.31% drop in 2020 shows signs of the premium offering users good trade-in values.
- Samsung A50: The Samsung A50’s, launching in March 2019, to a hit so big in the first nine months of release, its decline plateaued early in 2020. It lost -77.80% of its original value in 2019, which only declined to a total loss of -79.94% by the end of 2020.
- Galaxy Fold: The Samsung Galaxy Fold lost the most value in 2020, -$244, and this was to be expected after the jolting launch in 2019 due to screen issues, not to mention the high retail price of $1,980.
- Galaxy Fold: 4-months following its definitive September 2019 release, the Galaxy Fold entered 2020 with a resale value of $900, already losing the majority of its value.
Google Pixel Depreciation (2020-2021)
Price Drops By Popular Trade-ins & Report Highlights
Below, we’ve ranked the most popular Google Pixel phones via buyback popularity, showing 12-month Google Pixel depreciation rates and value loss.
- Consumers who owned one of the top 10 most traded-in Google Pixel phones in 2020 lost an average of -40.17% of the device’s value in 12 months. (-25.83% to -54.51%)
- Out of the top 10, 2019’s Pixel 4 lost the highest value in 2020 at -$160, which worked out to be -40.06% of the device’s original value in Jan 2020.
- Out of the top 10, 2017’s Google Pixel 2 had the highest depreciation, losing -54.51% of its value.
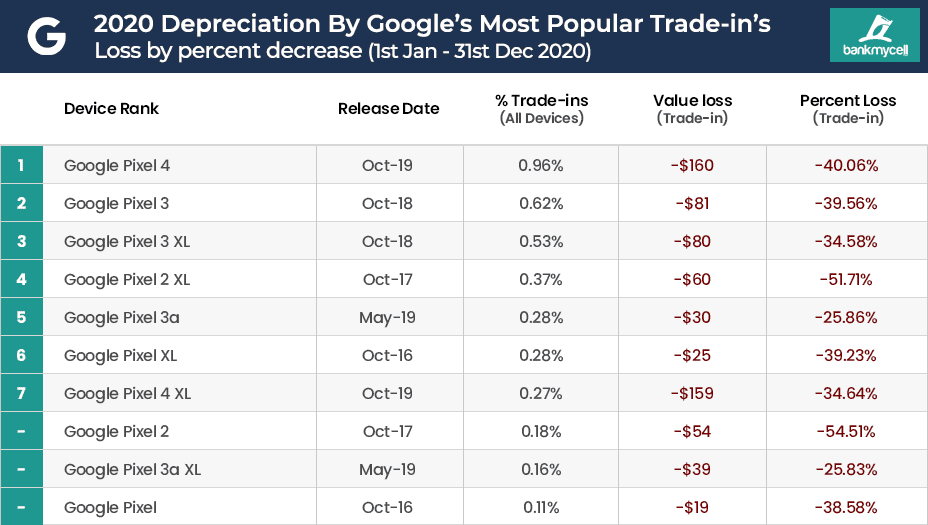
Data source: Google Pixel phones are ranked by trade-in popularity from 01/01/2020 to 12/31/2020, showing the top ‘good’ condition trade-in value across multiple buyback stores. Depreciation and value loss figures are averages across storage capacity specific quotes. Our data excludes limited-time trade-in or upgrade promo campaigns from brands and carriers.
Google Pixel Depreciation Highlights
Ignoring the top 10 trade-in popularity, below are any standout data points from the brand’s depreciation.
- Google Pixel 4/4 XL devices were the cheapest and last flagship phones to launch in 2019. However, they managed to lose the highest value of $159-$160
- As well as making the overall highest value loss list, 2019’s Google Pixel 4/4 XL made the highest depreciation list too, -34.64% and -40.06%.
LG Depreciation (2020-2021)
Price Drops By Popular Trade-ins & Report Highlights
Below, we’ve ranked the most popular LG phones via buyback popularity, showing 12-month LG phone depreciation rates and value loss.
- Consumers who owned one of the top 10 most traded-in LG phones in 2020 lost an average of -25.10% of the device’s value in 12 months (-7.89% to -42.31%)*
- Out of the top 10, 2018’s LG V40 ThinQ lost the highest value in 2020 at -$25, which worked out to be -17.86% of the device’s original value in Jan 2020.*
- Out of the top 10, 2015’s LG V10 had the highest depreciation, losing -42.31% of its value.*
*Important: Low 2020 depreciation rates don’t necessarily mean devices have held value, as per our 4-year android loss chart, many Android devices lose value heavily in the first 1-2 years.
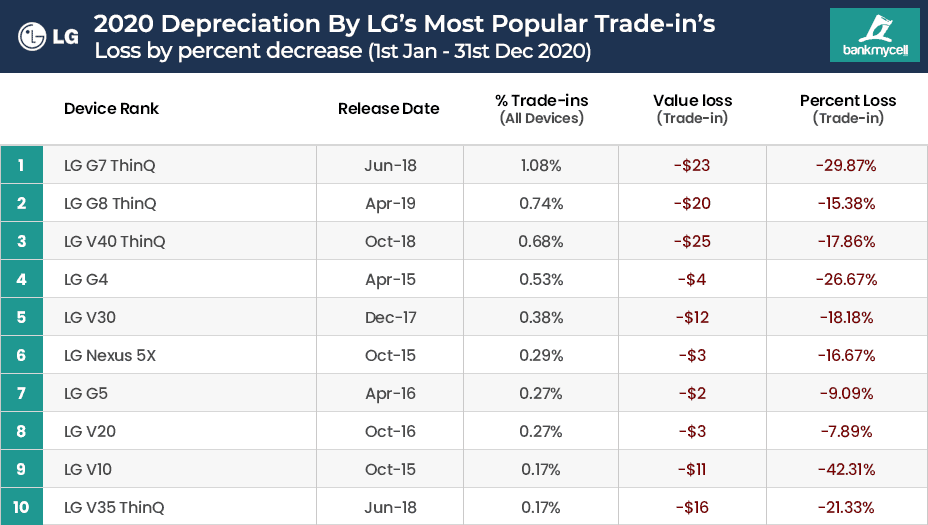
Data source: LG phones are ranked by trade-in popularity from 01/01/2020 to 12/31/2020, showing the top ‘good’ condition trade-in value across multiple buyback stores. Depreciation and value loss figures are averages across storage capacity specific quotes. Our data excludes limited-time trade-in or upgrade promo campaigns from brands and carriers.
LG Depreciation Highlights
Ignoring the top 10 trade-in popularity, below are any standout data points from the brand’s depreciation.
- The LG G8 ThinQ launched in April 2018 for $749. Two-years after launch it was only worth less than 10% of its release price ($70).
- The LG G7 ThinQ launched in April 2019 for $850. One year and eight months later, by the end of 2020, it was only worth $110 (-87.06% less than its launch price).
- LG’s 2017 flagship phone, the V30 Plus, also made the list of top depreciating phones. Priced at over $900 upon release, it is now only worth $30 after dropping a further -63.41% in 2020.
Motorloa Depreciation (2020-2021)
Price Drops By Popular Trade-ins & Report Highlights
Below, we’ve ranked the most popular Motorola Moto phones via buyback popularity, showing 12-month Motorola phone depreciation rates and value loss.
- Consumers who owned one of the top 10 most traded-in Motorola phones in 2020 lost an average of -39.32% of the device’s value in 12 months (-16.67% to -61.97%)*
- Out of the top 10, 2019’s Motorola G7 lost the highest value in 2020 at -$44.
- 2019’s Motorola G7 was also the highest depreciating Moto phone, losing -61.97% of its original value in Jan 2020.
*Important: Low 2020 depreciation rates don’t necessarily mean devices have held value, as per our 4-year android loss chart, many Android devices lose value heavily in the first 1-2 years.
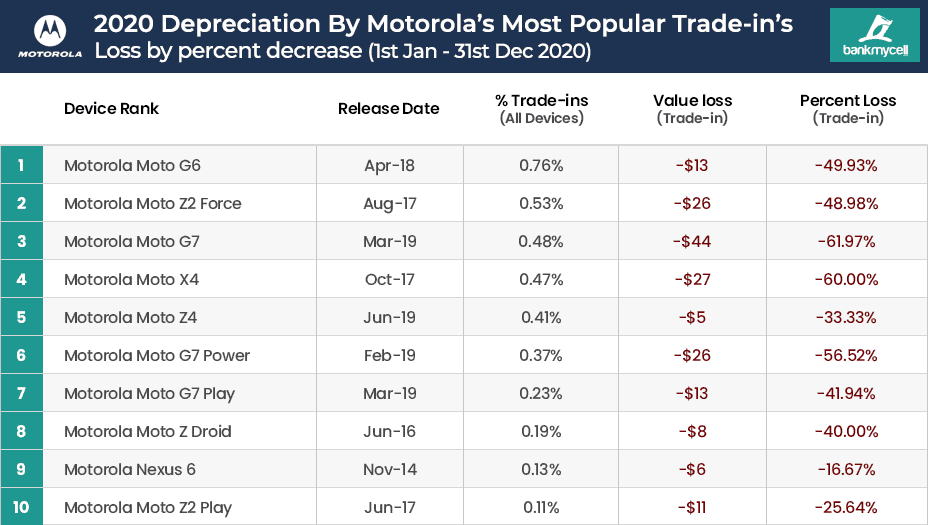
Data source: Motorola phones are ranked by trade-in popularity from 01/01/2020 to 12/31/2020, showing the top ‘good’ condition trade-in value across multiple buyback stores. Depreciation and value loss figures are averages across storage capacity specific quotes. Our data excludes limited-time trade-in or upgrade promo campaigns from brands and carriers.
Motorola Depreciation Highlights
Ignoring the top 10 trade-in popularity, below are any standout data points from the brand’s depreciation.
- The Moto G7 range lost -62.63 to -74.17% in the first 9 months of 2019; these budget Androids continued the steep decline -41.94% to -61.97% in 2020.
- The Moto G6 launched in April 2018, by the end of 2020 its value had declined to $13 (a massive -95.76% decline from retail)
Top 100 Phones Depreciation In 2020-2021
WINNERS AND LOSERS
Sortable Sample Data
The table below is sortable via the drop-down menu or by clicking on the column headers. Explore trends by brand, release date, trade-in popularity, value, and depreciation.
Data Methodology 2020-2021
BankMyCell receives pricing from multiple trade-in stores; the specific data methodology used in this report is:
- To measure accurate delines, we excluded limited-time trade-in or upgrade campaigns from brands and carriers.
- Unless specifically mentioned, all price and depreciation figures are tracked from the initial trade-in value (A to B date) NOT the device’s launch price.
- The highest device pricing is recorded each day from hourly price feed updates through multiple online buyback stores.
- The highest ‘good’ condition trade-in value is used for all charts as it’s the most common trade-in condition.
- All storage capacity pricing is recorded per device. Where applicable, average prices were created for the parent device.
- Depreciation is measured from the initial price recorded on 01/01/2020, or the first available for 2020 releases, and the final on 12/31/2020.
- Value loss is measured from the initial price recorded on 01/01/2020, or the first available for 2020 releases, and the final on 12/31/2020.
- Depreciation by operating system uses average data from all devices under the corresponding release price brackets.
- iOS Phones released with a price of over $700.
- Android phones released with a price of over $700.
- Budget Android phones released with a price under $350.
Today’s Phone Trade-In Prices
To get an idea of the values you can get when selling your old phone in the US, check out our main website:


