Tablet Market Share Globally & US (2025)

Most Popular Tablet Vendors by Market Share (Q1 2024)
Did you know that there is a thriving iPad and Android market for tablets?
As manufacturers continue improving tablet hardware and operating systems, average consumers pull back on spending on lower-tier tablets and are now more likely to buy premium devices.
Learn more about the latest in tablet demand and market shares of tablets for the iOS or Android market.
Editors Picks:
- Apple’s Tablet Market: Apple has a market share of 54.73% worldwide in 2024, an increase of 0.35% compared to Q4 of 2023. It is the largest vendor in the global tablet market.
- Samsung’s Tablet Market: Samsung maintains its position as the world’s second-largest tablet vendor, with a quarterly global market share of 26.88% in 2024, a decline of 0.82% compared to the fourth quarter of 2023.
- Huawei’s Tablet Market: Huawei’s most recent quarterly market share this 2024 is 2.34%, a decline of 0.10% compared to the last quarter of 2023.
- Asus’ Tablet Market: Asus currently accounts for 0.48% of global tablet quarterly shipments in 2024 worldwide, a 0.09% decrease compared to the fourth quarter of 2023.
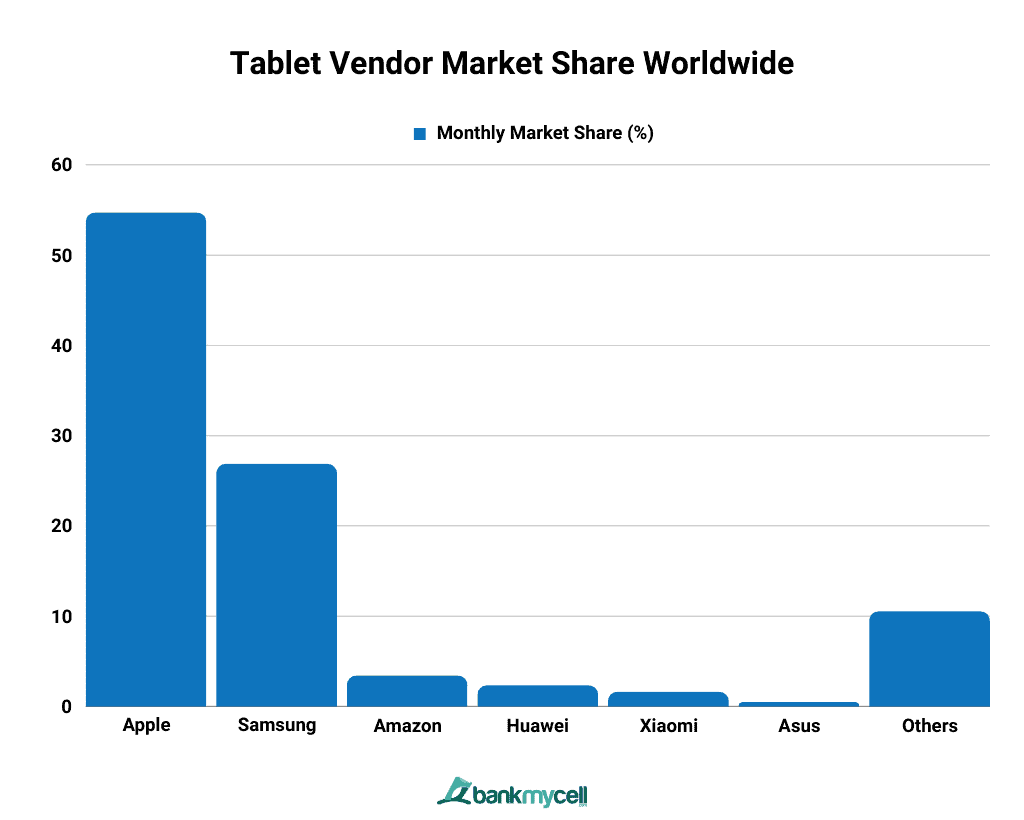
- Global Tablet Market: In 2024, Apple has the highest shipments of tablets, with a 54.73% market share. Samsung is second with 26.88%. Amazon is third with 3.41%, Huawei in fourth place with 2.34%, Xiaomi fifth with 1.62%, and Asus sixth with 0.48%.
- US Tablet Market: In the US, Apple’s iPads still take the lead with a 57.49% quarterly market share in 2024. Samsung comes second with 15.88% market share, and Amazon is third with 8.73%.
Most Popular Tablet Vendors by Market Share
Tablet Vendor Market Share Worldwide (This Month)
| Brand | Monthly Market Share (%) |
|---|---|
| Apple | 54.73 |
| Samsung | 26.88 |
| Amazon | 3.41 |
| Huawei | 2.34 |
| Xiaomi | 1.62 |
| Asus | 0.48 |
| Others | 10.55 |
- Data Table
-
Brand Monthly Market Share (%) Apple 54.73 Samsung 26.88 Amazon 3.41 Huawei 2.34 Xiaomi 1.62 Asus 0.48 Others 10.55 - Data Graph
-

Apple holds the global lead with the largest tablet vendor market share of 54.73% this month. Samsung comes in second with 26.88%, and Amazon comes in third with 3.41%. In the same period, Chinese brands Huawei and Xiaomi come in fourth and fifth place globally at 2.34% and 1.62% market share, respectively.
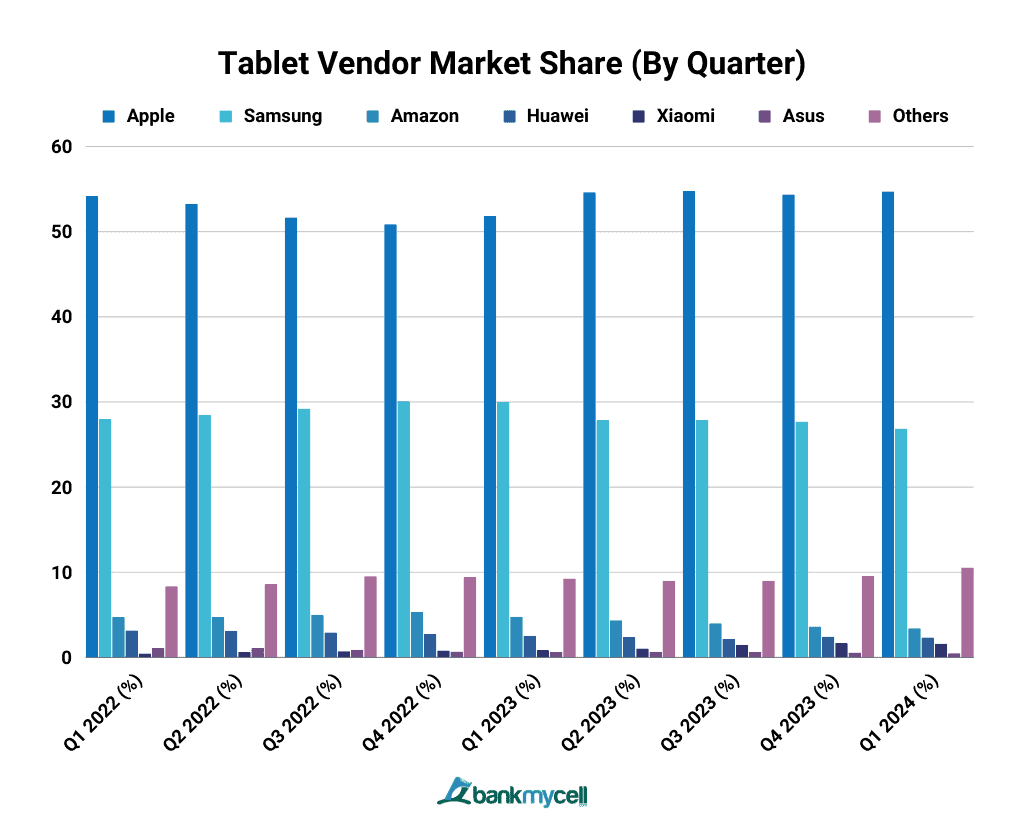
Tablet Vendor Market Share (By Quarter)
| Brand | Q2 2022 (%) | Q3 2022 (%) | Q4 2022 (%) | Q1 2023 (%) | Q2 2023 (%) | Q3 2023 (%) | Q4 2023 (%) | Q1 2024 (%) |
|---|---|---|---|---|---|---|---|---|
| Apple | 53.27 | 51.67 | 50.89 | 51.86 | 54.63 | 54.79 | 54.38 | 54.73 |
| Samsung | 28.51 | 29.22 | 30.08 | 30.01 | 27.88 | 27.88 | 27.7 | 26.88 |
| Amazon | 4.73 | 5 | 5.33 | 4.78 | 4.37 | 4.02 | 3.63 | 3.41 |
| Huawei | 3.14 | 2.93 | 2.75 | 2.55 | 2.39 | 2.17 | 2.44 | 2.34 |
| Xiaomi | 0.63 | 0.73 | 0.81 | 0.86 | 1.05 | 1.49 | 1.69 | 1.62 |
| Asus | 1.11 | 0.91 | 0.7 | 0.64 | 0.67 | 0.64 | 0.57 | 0.48 |
| Others | 8.61 | 9.52 | 9.44 | 9.28 | 8.99 | 8.99 | 9.57 | 10.55 |
- Data Table
-
Brand Q2 2022 (%) Q3 2022 (%) Q4 2022 (%) Q1 2023 (%) Q2 2023 (%) Q3 2023 (%) Q4 2023 (%) Q1 2024 (%) Apple 53.27 51.67 50.89 51.86 54.63 54.79 54.38 54.73 Samsung 28.51 29.22 30.08 30.01 27.88 27.88 27.7 26.88 Amazon 4.73 5 5.33 4.78 4.37 4.02 3.63 3.41 Huawei 3.14 2.93 2.75 2.55 2.39 2.17 2.44 2.34 Xiaomi 0.63 0.73 0.81 0.86 1.05 1.49 1.69 1.62 Asus 1.11 0.91 0.7 0.64 0.67 0.64 0.57 0.48 Others 8.61 9.52 9.44 9.28 8.99 8.99 9.57 10.55 - Data Graph
-

Apple’s iPads, which run on iOS, have a 54.73% worldwide market share in 2024. It is followed by Samsung tablets, which run on the Android operating system, at 26.88%. These two brands take up more than 80% of the market share of the tablet industry.
According to Strategy Analytics, purchases favor detachable tablets and premium tablets during the second quarter of 2022. The high demand was caused by user behaviors favoring hybrid work.
According to industry analyst Chirag Upadhyay, Apple profits as its wealthy consumers continue spending more than the Android user base.
In terms of tablet OS market share, the Android tablet market share reached a new low of 50% in the first quarter of 2022. Competition among Android vendors seeking to grab market share from Huawei’s smaller device footprint had heated up.
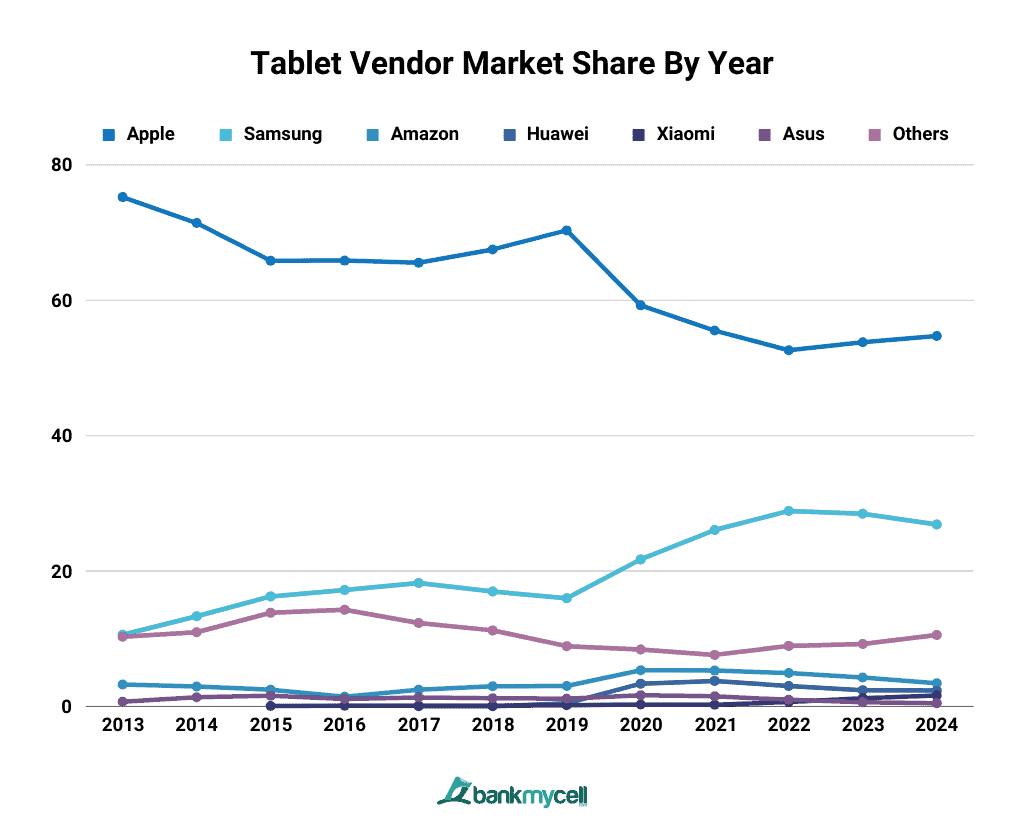
Tablet Vendor Market Share By Year (2013-2024)
| Brand | 2013 | 2014 | 2015 | 2016 | 2017 | 2018 | 2019 | 2020 | 2021 | 2022 | 2023 | 2024 |
|---|---|---|---|---|---|---|---|---|---|---|---|---|
| Apple | 75.24 | 71.41 | 65.85 | 65.86 | 65.53 | 67.51 | 70.32 | 59.25 | 55.52 | 52.62 | 53.8 | 54.73 |
| Samsung | 10.59 | 13.32 | 16.25 | 17.19 | 18.24 | 16.97 | 15.97 | 21.72 | 26.06 | 28.88 | 28.47 | 26.88 |
| Amazon | 3.24 | 2.94 | 2.47 | 1.42 | 2.46 | 2.98 | 3.02 | 5.35 | 5.29 | 4.93 | 4.26 | 3.41 |
| Huawei | - | - | - | - | 0.01 | 0.01 | 0.45 | 3.36 | 3.77 | 3.01 | 2.4 | 2.34 |
| Xiaomi | - | - | 0.05 | 0.1 | 0.11 | 0.1 | 0.17 | 0.28 | 0.25 | 0.64 | 1.22 | 1.62 |
| Asus | 0.68 | 1.35 | 1.58 | 1.11 | 1.33 | 1.2 | 1.14 | 1.64 | 1.49 | 0.97 | 0.63 | 0.48 |
| Others | 10.28 | 10.96 | 13.84 | 14.29 | 12.31 | 11.23 | 8.9 | 8.41 | 7.61 | 8.94 | 9.21 | 10.55 |
- Data Table
-
Brand 2013 2014 2015 2016 2017 2018 2019 2020 2021 2022 2023 2024 Apple 75.24 71.41 65.85 65.86 65.53 67.51 70.32 59.25 55.52 52.62 53.8 54.73 Samsung 10.59 13.32 16.25 17.19 18.24 16.97 15.97 21.72 26.06 28.88 28.47 26.88 Amazon 3.24 2.94 2.47 1.42 2.46 2.98 3.02 5.35 5.29 4.93 4.26 3.41 Huawei - - - - 0.01 0.01 0.45 3.36 3.77 3.01 2.4 2.34 Xiaomi - - 0.05 0.1 0.11 0.1 0.17 0.28 0.25 0.64 1.22 1.62 Asus 0.68 1.35 1.58 1.11 1.33 1.2 1.14 1.64 1.49 0.97 0.63 0.48 Others 10.28 10.96 13.84 14.29 12.31 11.23 8.9 8.41 7.61 8.94 9.21 10.55 - Data Graph
-

Apple has the highest yearly market share for tablets in 2024, with 54.73%, and Samsung comes in second with 26.88%. Apple’s global market share increased by 0.93% from 2023, while Samsung’s decreased by 1.59%. Amazon comes in third with 3.41%, Huawei in fourth place with 2.34%, and Xiaomi in fifth place with 1.62% market share.
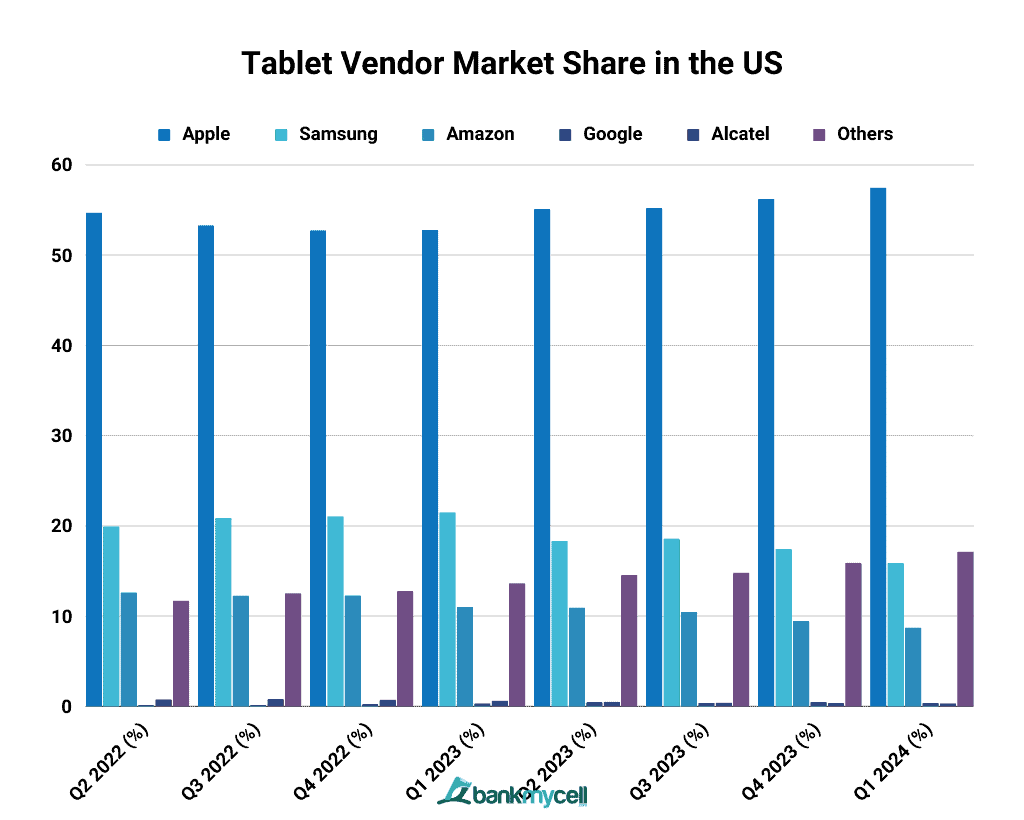
Tablet Vendor Market Share in the US (Quarterly)
| Brands | Q2 2022 (%) | Q3 2022 (%) | Q4 2022 (%) | Q1 2023 (%) | Q2 2023 (%) | Q3 2023 (%) | Q4 2023 (%) | Q1 2024 (%) |
|---|---|---|---|---|---|---|---|---|
| Apple | 54.72 | 53.31 | 52.77 | 52.81 | 55.13 | 55.23 | 56.24 | 57.49 |
| Samsung | 19.97 | 20.87 | 21.08 | 21.52 | 18.36 | 18.61 | 17.46 | 15.88 |
| Amazon | 12.64 | 12.28 | 12.32 | 11.03 | 10.95 | 10.48 | 9.49 | 8.73 |
| 0.15 | 0.19 | 0.27 | 0.35 | 0.48 | 0.41 | 0.51 | 0.4 | |
| Alcatel | 0.79 | 0.82 | 0.76 | 0.64 | 0.52 | 0.44 | 0.37 | 0.34 |
| Others | 11.73 | 12.54 | 12.79 | 13.65 | 14.55 | 14.83 | 15.93 | 17.15 |
- Data Table
-
Brands Q2 2022 (%) Q3 2022 (%) Q4 2022 (%) Q1 2023 (%) Q2 2023 (%) Q3 2023 (%) Q4 2023 (%) Q1 2024 (%) Apple 54.72 53.31 52.77 52.81 55.13 55.23 56.24 57.49 Samsung 19.97 20.87 21.08 21.52 18.36 18.61 17.46 15.88 Amazon 12.64 12.28 12.32 11.03 10.95 10.48 9.49 8.73 Google 0.15 0.19 0.27 0.35 0.48 0.41 0.51 0.4 Alcatel 0.79 0.82 0.76 0.64 0.52 0.44 0.37 0.34 Others 11.73 12.54 12.79 13.65 14.55 14.83 15.93 17.15 - Data Graph
-

In the US tablet market, Apple’s iPads still take the lead in 2024 with a 57.49% quarterly market share. It takes a 41.61% lead over Samsung, which has a 15.88% market share. Amazon is third, with an 8.73% market share.
Compared to the global rankings, however, Chinese brands Huawei and Xiaomi do not occupy the top five tablet vendors in America. They are replaced instead by Google and Alcatel with a 0.40% and 0.34% market share, respectively.
APPLE
iPad Market Share
Apple’s iPad market share is currently 54.73%, a 1.02% decline from the peak monthly market share in 2023 at 55.75%. Apple iPadOS shipments continue to lead all tablet vendors.
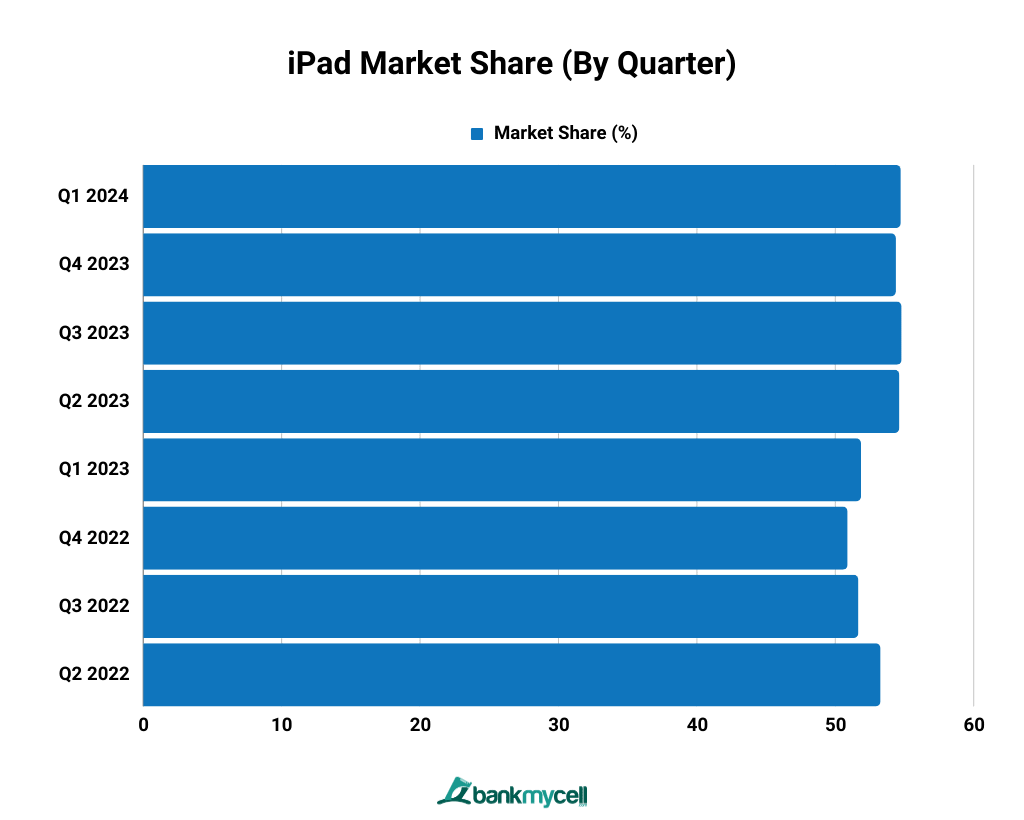
iPad Market Share (By Quarter)
| Quarter | Market Share (%) |
|---|---|
| Q1 2024 | 54.73 |
| Q4 2023 | 54.38 |
| Q3 2023 | 54.79 |
| Q2 2023 | 54.63 |
| Q1 2023 | 51.86 |
| Q4 2022 | 50.89 |
| Q3 2022 | 51.67 |
| Q2 2022 | 53.27 |
- Data Table
-
Quarter Market Share (%) Q1 2024 54.73 Q4 2023 54.38 Q3 2023 54.79 Q2 2023 54.63 Q1 2023 51.86 Q4 2022 50.89 Q3 2022 51.67 Q2 2022 53.27 - Data Graph
-

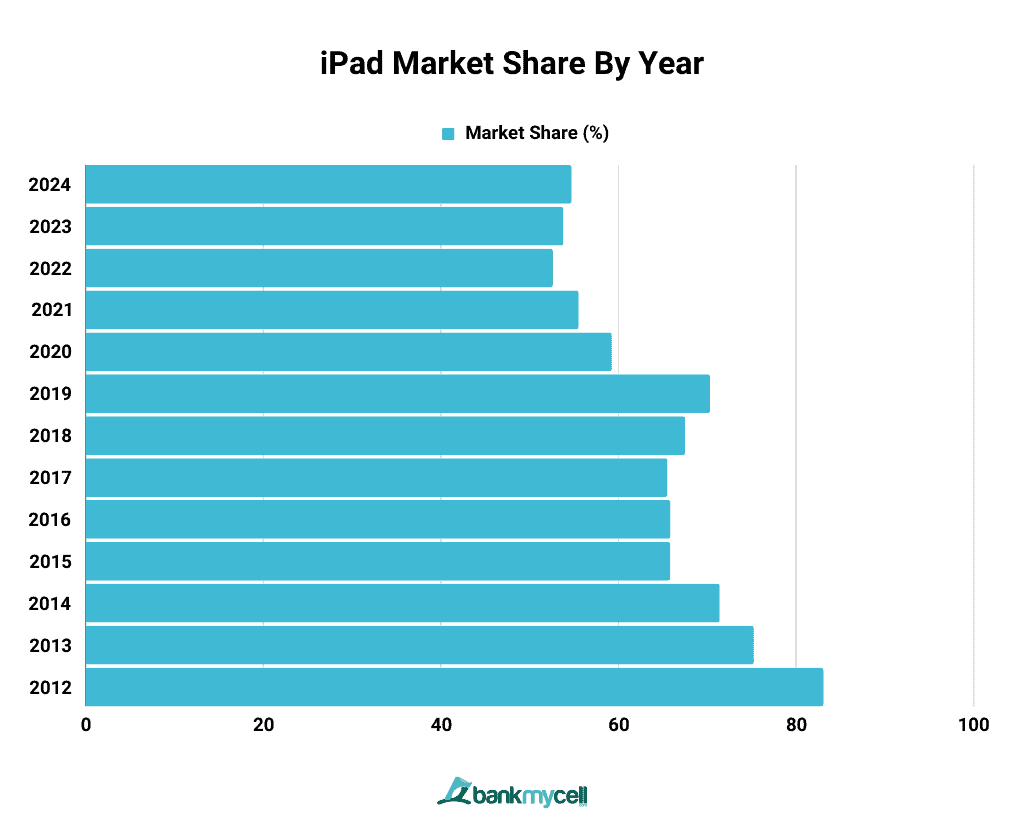
Apple recorded a market share of 54.73% for its iPads in 2024, placing it first among tablet vendors worldwide. Its current market share is a 0.35% increase compared to the fourth quarter of 2023. Apple iPad shipments consistently took more than 50% of the market share in the last five quarters.
iPad Market Share By Year (2012-2024)
| Year | Market Share % |
|---|---|
| 2024 | 54.73 |
| 2023 | 53.8 |
| 2022 | 52.62 |
| 2021 | 55.52 |
| 2020 | 59.25 |
| 2019 | 70.32 |
| 2018 | 67.51 |
| 2017 | 65.53 |
| 2016 | 65.86 |
| 2015 | 65.85 |
- Data Table
-
Year Market Share % 2024 54.73 2023 53.8 2022 52.62 2021 55.52 2020 59.25 2019 70.32 2018 67.51 2017 65.53 2016 65.86 2015 65.85 - Data Graph
-

Apple so far has recorded a yearly market share of 54.73% for its iPads in 2024, an increase of 0.93% from 2023. It consistently held the largest market share globally from 2012 to the present.
SAMSUNG
Samsung Tablets Market Share
Samsung’s current monthly worldwide market share is 26.88%, a 4.33% decline compared to its peak in 2023 at 31.21%. It currently ranks second in monthly shares as it remains behind Apple by 27%.
Samsung Tablet Market Share (By Quarter)
| Quarter | Market Share (%) |
|---|---|
| Q1 2024 | 26.88 |
| Q4 2023 | 27.7 |
| Q3 2023 | 27.88 |
| Q2 2023 | 27.88 |
| Q1 2023 | 30.01 |
| Q4 2022 | 30.08 |
| Q3 2022 | 29.22 |
| Q2 2022 | 28.51 |
| Q1 2022 | 27.99 |
- Data Table
-
Quarter Market Share (%) Q1 2024 26.88 Q4 2023 27.7 Q3 2023 27.88 Q2 2023 27.88 Q1 2023 30.01 Q4 2022 30.08 Q3 2022 29.22 Q2 2022 28.51 Q1 2022 27.99 - Data Graph
-

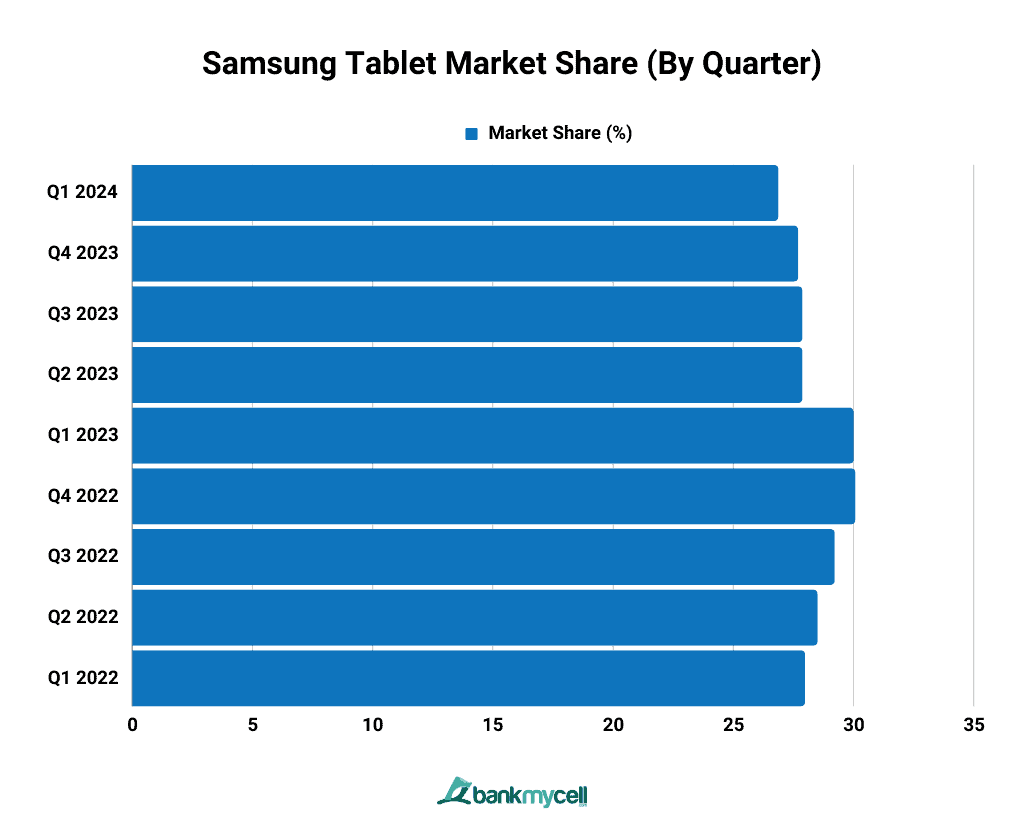
In 2024, Samsung’s global shipments reached 26.88%, placing it second among tablet vendors worldwide in terms of market share. The brand holds the largest Android tablet market share.
Samsung Tablet Market Share By Year (2012-2024)
| Year | Market Share % |
|---|---|
| 2024 | 26.88 |
| 2023 | 28.47 |
| 2022 | 28.88 |
| 2021 | 26.06 |
| 2020 | 21.72 |
| 2019 | 15.97 |
| 2018 | 16.97 |
| 2017 | 18.24 |
| 2016 | 17.19 |
| 2015 | 16.25 |
- Data Table
-
Year Market Share % 2024 26.88 2023 28.47 2022 28.88 2021 26.06 2020 21.72 2019 15.97 2018 16.97 2017 18.24 2016 17.19 2015 16.25 - Data Graph
-

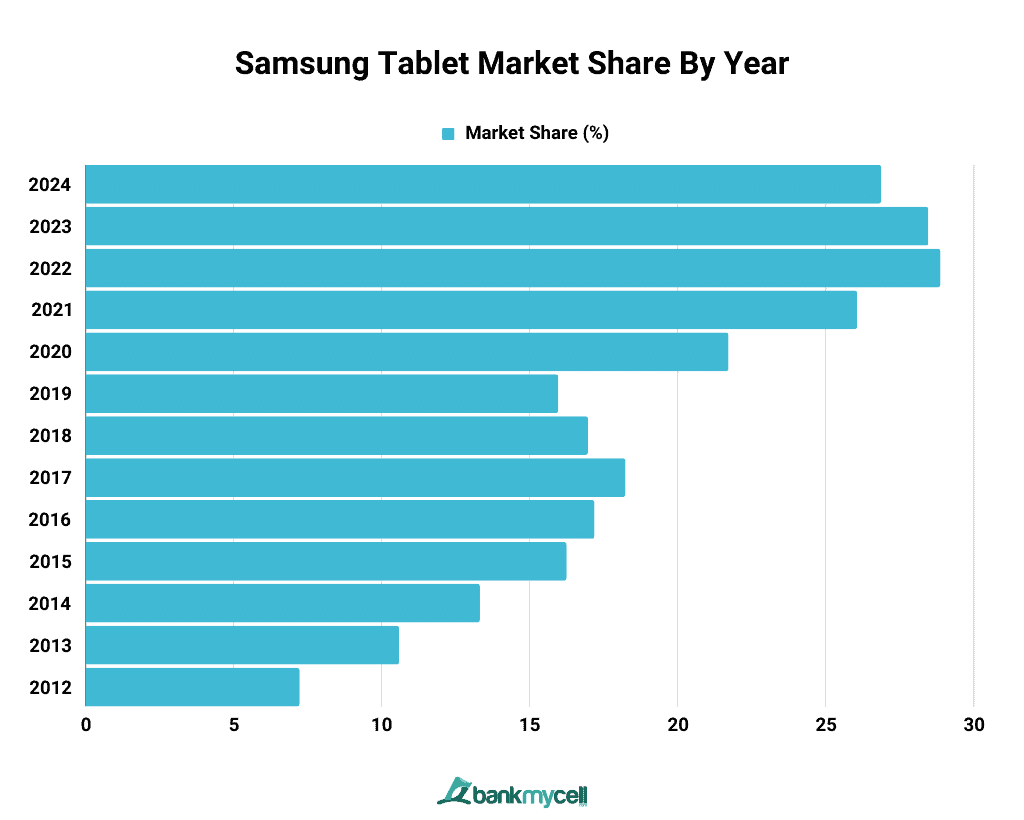
Samsung’s annual global market share for tablet shipments for 2024 is 28.66%, a decline of 1.59% from 2023. Its 2022 figures are the company’s highest market share since 2012.
HUAWEI
Huawei Tablet Market Share
Huawei’s global market share for its tablets is 2.34%, a 0.22% decrease from its 2.56% peak monthly market share in 2023. It trails behind Amazon, which has a 3.41% market share this month, but has a larger share than Xioami, which has 1.62%.
Huawei Tablet Market Share (By Quarter)
| Quarter | Market Share (%) |
|---|---|
| Q1 2024 | 2.34 |
| Q4 2023 | 2.44 |
| Q3 2023 | 2.17 |
| Q2 2023 | 2.39 |
| Q1 2023 | 2.55 |
| Q4 2022 | 2.75 |
| Q3 2022 | 2.93 |
| Q2 2022 | 3.14 |
| Q1 2022 | 3.15 |
- Data Table
-
Quarter Market Share (%) Q1 2024 2.34 Q4 2023 2.44 Q3 2023 2.17 Q2 2023 2.39 Q1 2023 2.55 Q4 2022 2.75 Q3 2022 2.93 Q2 2022 3.14 Q1 2022 3.15 - Data Graph
-

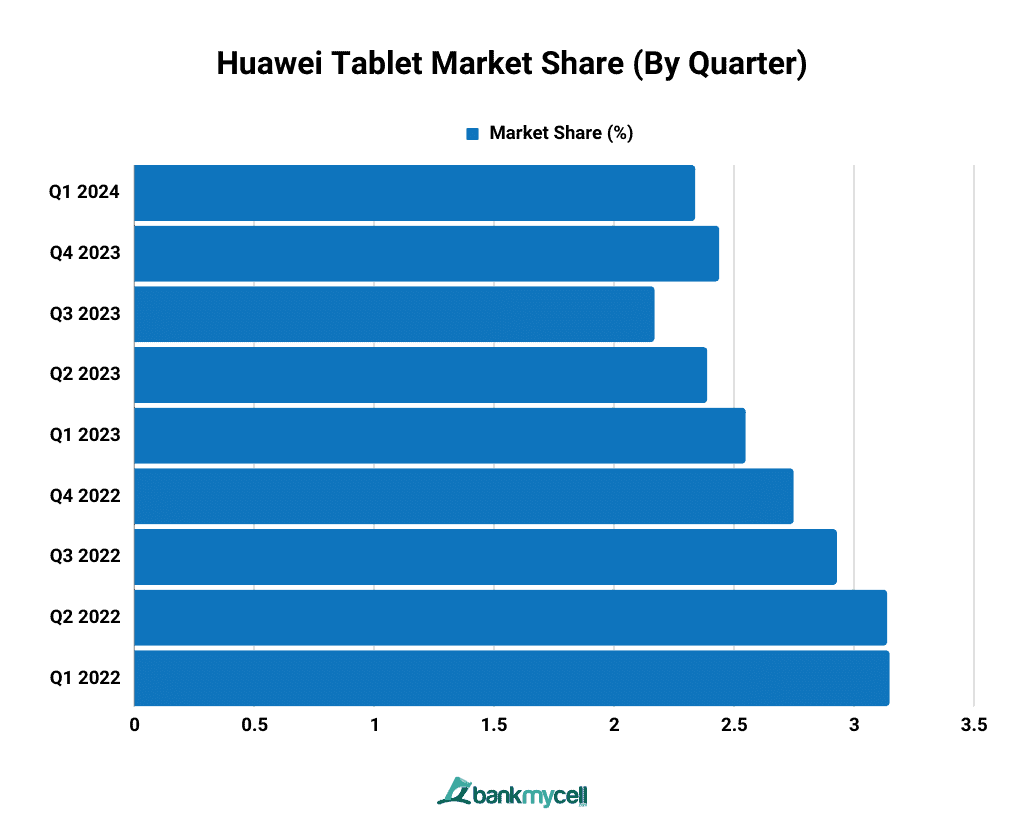
Huawei was responsible for 2.34% of all tablet shipments worldwide in 2024, ranking it fourth in terms of tablet vendor market share. The company’s current share shows a decline of 0.10% compared to Q4 2023.
In the previous five quarters, Huawei’s share peaked in the first quarter of 2022 at 3.15%, but it has been steadily declining since then.
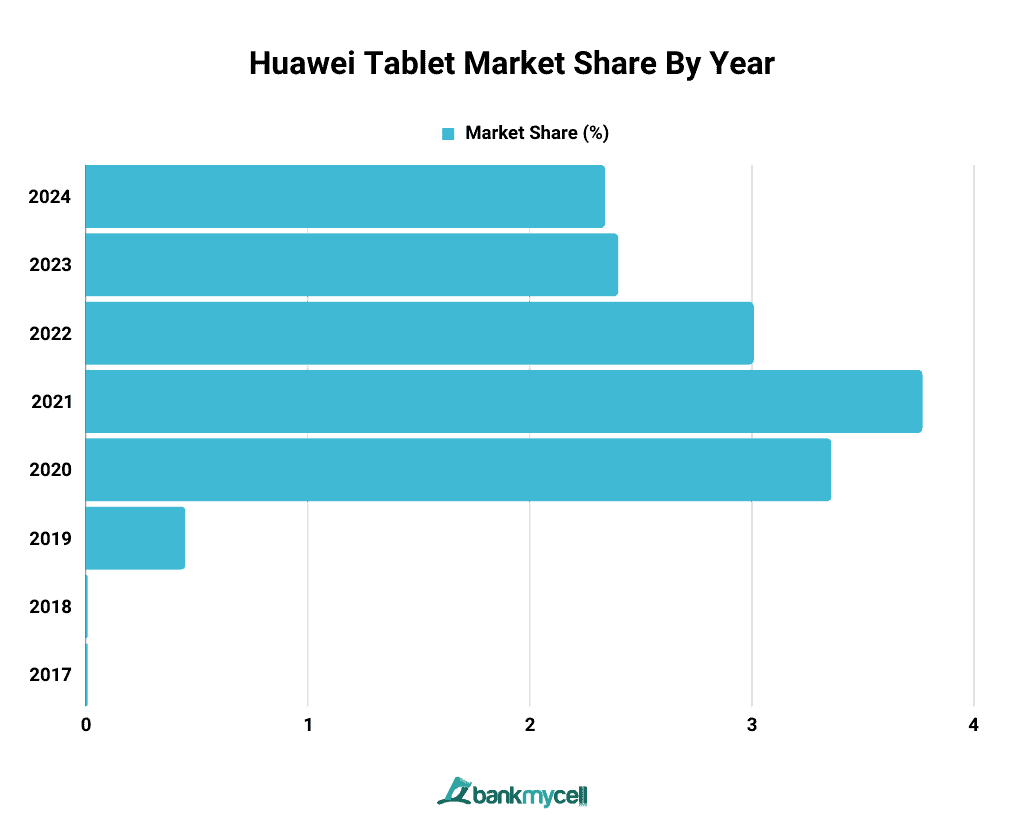
Huawei Tablet Market Share By Year (2012-2024)
| Year | Market Share (%) |
|---|---|
| 2024 | 2.34 |
| 2023 | 2.4 |
| 2022 | 3.01 |
| 2021 | 3.77 |
| 2020 | 3.36 |
| 2019 | 0.45 |
| 2018 | 0.01 |
| 2017 | 0.01 |
- Data Table
-
Year Market Share (%) 2024 2.34 2023 2.4 2022 3.01 2021 3.77 2020 3.36 2019 0.45 2018 0.01 2017 0.01 - Data Graph
-

Huawei’s yearly market share for 2024 is 2.34%, a 0.06% decrease from 2023. The company’s tablet shipments peaked in 2021, with a share of 3.77%, but there was a downward trend in the succeeding years.
ASUS
Asus Tablet Market Share
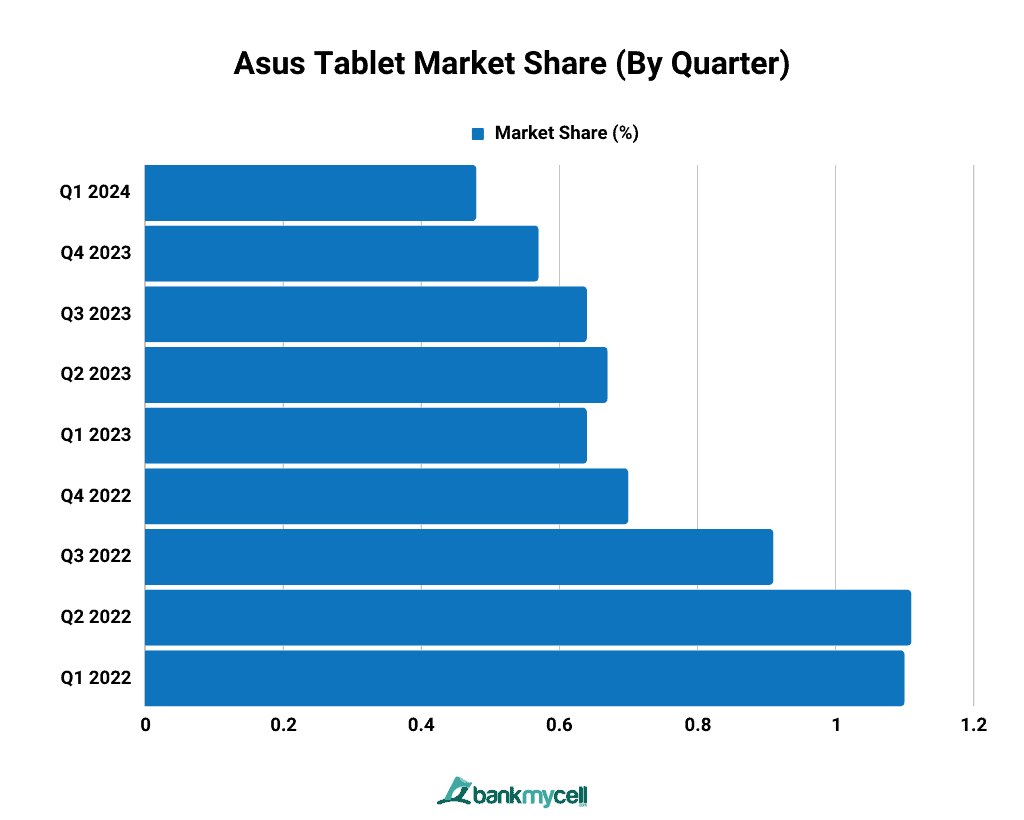
Asus has a market share of 0.48% this month, a decrease of 0.21% compared to its peak monthly market share in 2023 at 0.69%. It does not make the top five vendors with the highest monthly share, but it is higher than Alcatel, Acer, and Google, which all have a market share lower than 0.30%.
Asus Tablet Market Share (By Quarter)
| Quarter | Market Share (%) |
|---|---|
| Q1 2024 | 0.48 |
| Q4 2023 | 0.57 |
| Q3 2023 | 0.64 |
| Q2 2023 | 0.67 |
| Q1 2023 | 0.64 |
| Q4 2022 | 0.7 |
| Q3 2022 | 0.91 |
| Q2 2022 | 1.11 |
| Q1 2022 | 1.1 |
- Data Table
-
Quarter Market Share (%) Q1 2024 0.48 Q4 2023 0.57 Q3 2023 0.64 Q2 2023 0.67 Q1 2023 0.64 Q4 2022 0.7 Q3 2022 0.91 Q2 2022 1.11 Q1 2022 1.1 - Data Graph
-

Asus contributed approximately 0.48% of global tablet shipments in the most recent quarter of 2024, a 0.09% decrease compared to Q4 2023.
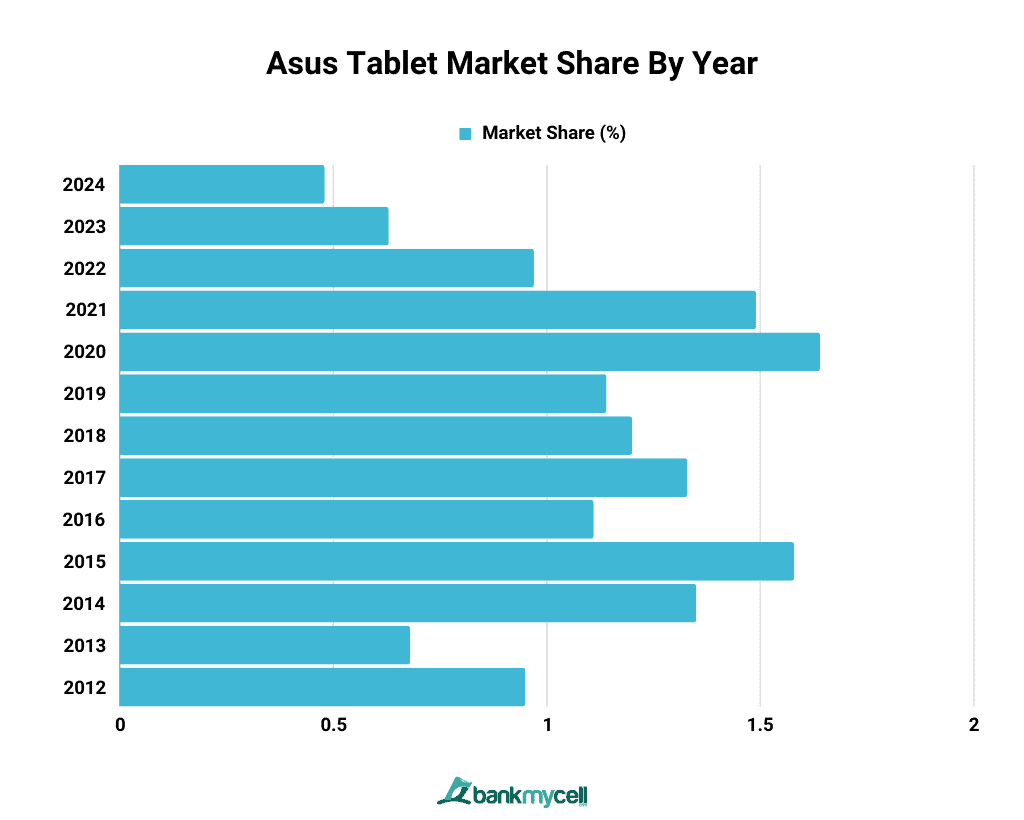
Asus Tablet Market Share By Year (2012-2024)
| Year | Market Share (%) |
|---|---|
| 2024 | 0.48 |
| 2023 | 0.63 |
| 2022 | 0.97 |
| 2021 | 1.49 |
| 2020 | 1.64 |
| 2019 | 1.14 |
| 2018 | 1.2 |
| 2017 | 1.33 |
| 2016 | 1.11 |
| 2015 | 1.58 |
| 2014 | 1.35 |
| 2013 | 0.68 |
| 2012 | 0.95 |
- Data Table
-
Year Market Share (%) 2024 0.48 2023 0.63 2022 0.97 2021 1.49 2020 1.64 2019 1.14 2018 1.2 2017 1.33 2016 1.11 2015 1.58 2014 1.35 2013 0.68 2012 0.95 - Data Graph
-

Asus currently accounts for 0.48% of global tablet shipments in 2024, a 0.15% decrease from the previous year. It currently holds the sixth-largest market share for tablets worldwide.
