How Many iPhones Have Been Sold?
iPhone Shipment and Sales Statistics in 2025


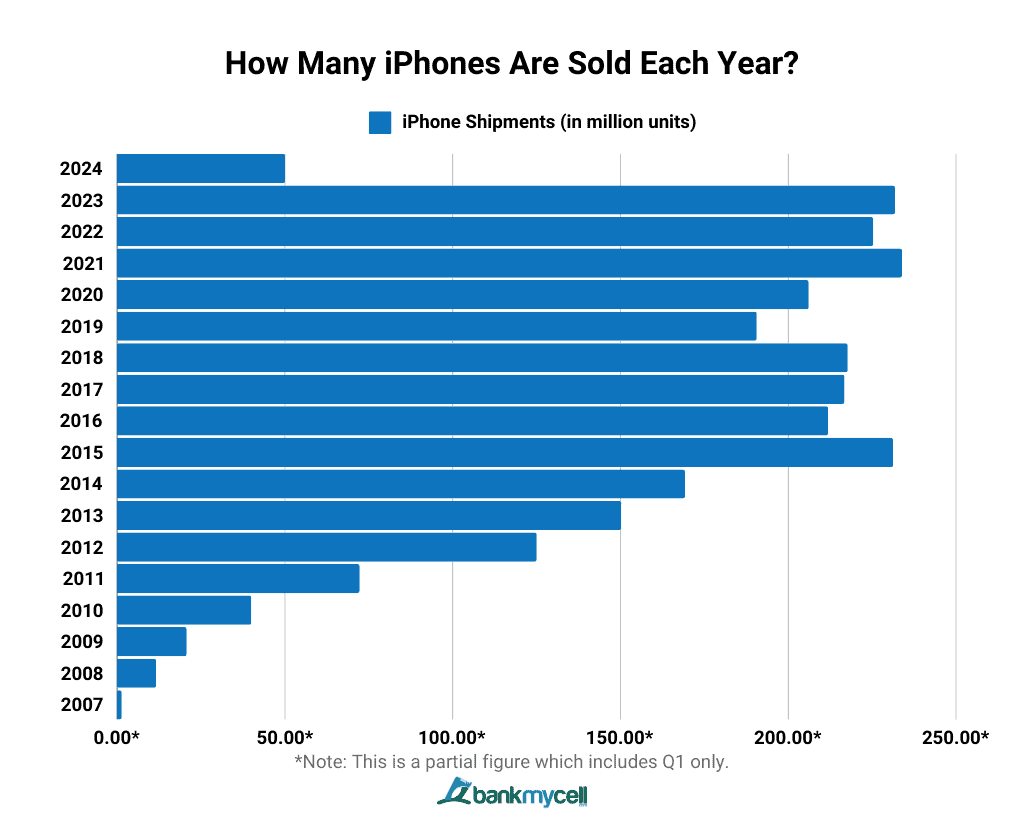
Did you know that Apple sold over 231.80 million iPhones in 2023-2024 alone? Apple remains one of the leading smartphone manufacturers globally.
iPhones also account for a significant portion of Apple’s revenue, with the smartphone generating a total of 200.58 billion USD in revenue in 2022. This is more than 52% of the company’s annual total revenue of 383.29 billion USD.
With the continued success of iPhones in the market due to high sales and loyal iPhone users, it’s interesting to examine Apple’s growth over the years. Read more to learn about the Apple iPhone market share, how many iPhones have been sold in recent years, revenue shares, and many more.
Editors Picks:
- How Many iPhones are Sold a Year: Last year, approximately 231.80 million iPhone models were sold, showing a 2.9% increase from 2022. iPhones alone brought in a USD 200.58 billion revenue, 52% of Apple’s total revenue, in the same year.
- How Many iPhones Have Been Sold: To date, the iPhone remains one of the most popular cell phones in the world, with over 2.6 billion units sold since 2007. It has also taken the top spot in the global smartphone market, with a 30% market share in 2024 and over 50.10 million units shipped in just the first quarter of the year.
- How Many iPhones Did Apple Sell in The Beginning (2007): Following the release of the first iPhone generation in June 2007, Apple managed to sell 1.39 million units the rest of the year. iPhone unit sales increased rapidly year after year, reaching a record high of 233.9 million in 2019.
- iPhone Total Revenue: iPhone’s revenue in the first quarter of 2024 reached 69.702 billion USD, a 5.97% increase from the first quarter of 2023. The company’s total revenue for its iPhones in 2023 reached 200.583 billion USD, a 2.4% decline compared to the iPhone revenue in 2022.
- iPhone Sales Contribution to Apple Revenue: iPhone sales revenue accounted for more than 52% of Apple’s total revenue in 2023. Apple’s global revenue reached 383.29 billion USD that year.
- Apple’s Share in the US Smartphone Sales: iPhone statistics show that Apple is in the top spot this year with a 59% market share of smartphones in the United States. It is estimated that around 72.28 million iPhones were shipped and sold in the US in 2023. This indicates that more than half of the 124 million smartphone units shipped in the country are iPhones.
iPhone Total Sales and Shipped Units Worldwide
After 15 years in the global smartphone market, the iPhone remains one of the most popular smartphones in the world, as over 231.180 million iPhones have been sold in 2023 alone. iPhone sales increased by 2.9% from 2022 to 2023.
How Many iPhones Have Been Sold Since 2007?
Around 2.6 billion iPhones have already been sold around the globe in total since Apple launched its first model in 2007. While Apple’s success through the years has been undeniable, it seems like the iPhone will continue its trajectory in the foreseeable future as it takes the lead in the smartphone market share worldwide at 30% in the second quarter of 2024.
Key Stats:
- According to forecasts from March 26, 2020, sales of tech products were anticipated to decline during the first quarter of 2020 due to the COVID-19 pandemic. However, in 2021, Apple shipped more units internationally than ever before.
- Apple’s most popular iPhone device to date is the iPhone 6, while the iPhone X accounted for 35% of global smartphone profits.
- Apple maintains a low switch rate compared to Android due to widely available trade-in programs allowing smartphone users to trade in their old iPhones for new ones. Over 14% of those polled in the United States have switched to the iPhone in the last two years.
How Many iPhones are Sold Each Year? (2010-2024)
Number of iPhones Sold Annually
| Year | iPhone Shipments (in million units) |
|---|---|
| 2024 | 50.10* |
| 2023 | 231.8 |
| 2022 | 225.3 |
| 2021 | 233.9 |
| 2020 | 206.1 |
| 2019 | 190.6 |
| 2018 | 217.72 |
| 2017 | 216.76 |
| 2016 | 211.88 |
| 2015 | 231.22 |
| 2014 | 169.22 |
| 2013 | 150.26 |
| 2012 | 125.05 |
| 2011 | 72.29 |
| 2010 | 39.99 |
| 2009 | 20.73 |
| 2008 | 11.63 |
| 2007 | 1.39 |
*Note: This is a partial figure which includes Q1 only.

- Data Table
-
Year iPhone Shipments (in million units) 2024 50.10* 2023 231.8 2022 225.3 2021 233.9 2020 206.1 2019 190.6 2018 217.72 2017 216.76 2016 211.88 2015 231.22 2014 169.22 2013 150.26 2012 125.05 2011 72.29 2010 39.99 2009 20.73 2008 11.63 2007 1.39 *Note: This is a partial figure which includes Q1 only.
- Data Graphic
-

Apple’s annual sales and shipments were at an all-time high during 2021, when they shipped 233.90 million units. From 1.39 million iPhones sold in their first year in 2007, the tech giant has managed to solidify their position in the smartphone industry after managing to consistently sell around 200 million units of iPhones per year since 2014.
Key Stats:
- iPhone users statistics reveal that around 35% of iPhone users also have an Apple Watch.
- The country with the highest percentage of active iPhone users is Japan.
How Many iPhones are Sold Per Quarter? (2018-2024)
iPhones Sold per Quarter
| Quarter | Shipments (in million units) |
|---|---|
| Q1 2024 | 50.1 |
| Q4 2023 | 80.5 |
| Q3 2023 | 53.6 |
| Q2 2023 | 42.5 |
| Q1 2023 | 55.2 |
| Q4 2022 | 72.3 |
| Q3 2022 | 51.9 |
| Q2 2022 | 44.6 |
| Q1 2022 | 56.5 |
| Q4 2021 | 84.1 |
| Q3 2021 | 50.4 |
| Q2 2021 | 44.2 |
| Q1 2021 | 55.2 |

- Data Table
-
Quarter Shipments (in million units) Q1 2024 50.1 Q4 2023 80.5 Q3 2023 53.6 Q2 2023 42.5 Q1 2023 55.2 Q4 2022 72.3 Q3 2022 51.9 Q2 2022 44.6 Q1 2022 56.5 Q4 2021 84.1 Q3 2021 50.4 Q2 2021 44.2 Q1 2021 55.2 - Data Graphic
-

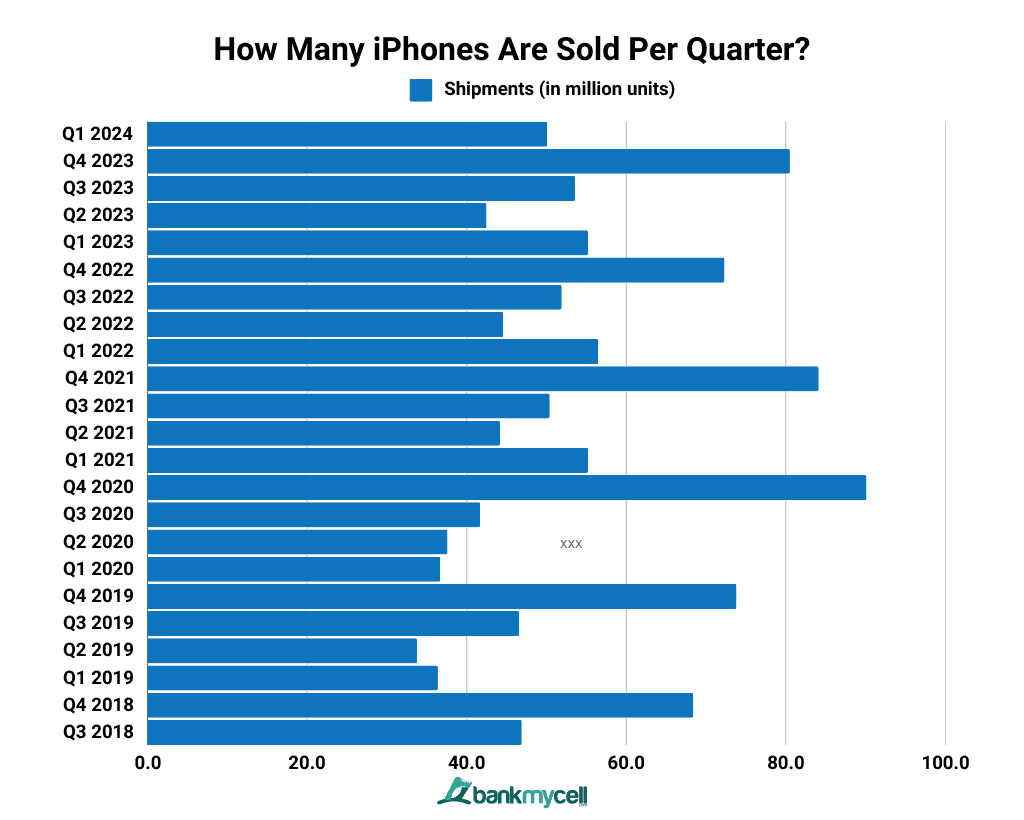
In the first quarter of 2024, approximately 50.1 million iPhone units were sold, representing a 9.4% decrease compared to the first quarter of 2023. In the last five years, Apple sales peaked in the fourth quarter of 2020, with 90.10 million units sold in that period.
Apple’s fourth-quarter sales have been at an all-time high. For example, in the fourth quarter of 2018, around 16.2 million more iPhones were sold compared to the first quarter. The fourth quarters of 2019, 2020, 2021, and 2022 also saw an increase of 37.4 million, 53.4 million, 28.9 million, and 15.8 million units over the first quarters.
Apple’s Revenue with iPhone in 2023
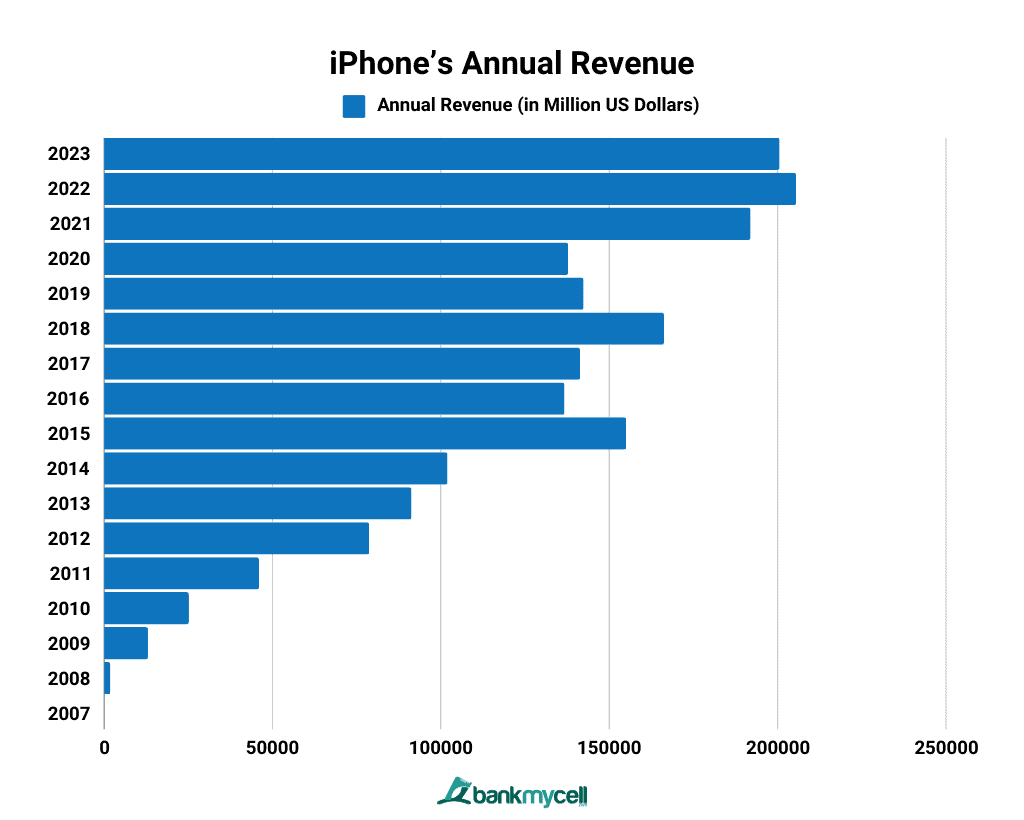
iPhone’s revenue in 2023 reached 200.583 billion USD, a 2.4% decrease from the last year. Apple generated 205.49 billion USD in 2022 for its iPhones, the most profitable year for the company yet.
iPhone’s Annual Revenue (2007-2023)
iPhone’s Annual Revenue
| Year | Annual Revenue (in Million US Dollars) |
|---|---|
| 2023 | 200,583 |
| 2022 | 205,489 |
| 2021 | 191,973 |
| 2020 | 137,781 |
| 2019 | 142,381 |
| 2018 | 166,269 |
| 2017 | 141,319 |
| 2016 | 136,700 |
| 2015 | 155,041 |
| 2014 | 101,991 |
| 2013 | 91,279 |
| 2012 | 78,692 |
| 2011 | 45,998 |
| 2010 | 25,179 |
| 2009 | 13,033 |
| 2008 | 1,844 |
| 2007 | 123 |

- Data Table
-
iPhone’s Annual Revenue
Year Annual Revenue (in Million US Dollars) 2023 200,583 2022 205,489 2021 191,973 2020 137,781 2019 142,381 2018 166,269 2017 141,319 2016 136,700 2015 155,041 2014 101,991 2013 91,279 2012 78,692 2011 45,998 2010 25,179 2009 13,033 2008 1,844 2007 123 - Data Graphic
-

Despite a slight decline in iPhone shipments, 2022 gave Apple’s record-breaking year in revenues for its iPhones, earning almost 205.49 billion USD. This is the highest revenue for Apple’s iPhone since its launch in 2007.
iPhone Percentage of Apple Revenue
The iPhone revenue accounted for more than 52% of Apple’s total revenue in 2023, emphasizing the segment’s importance in the tech giant’s business. Apple’s total revenue amounted to 383.29 billion USD in 2023, a slight decline of 2.8% from last year’s record-breaking 394.33 billion USD global revenue.
iPhone Total Sales and Shipped Units in the US
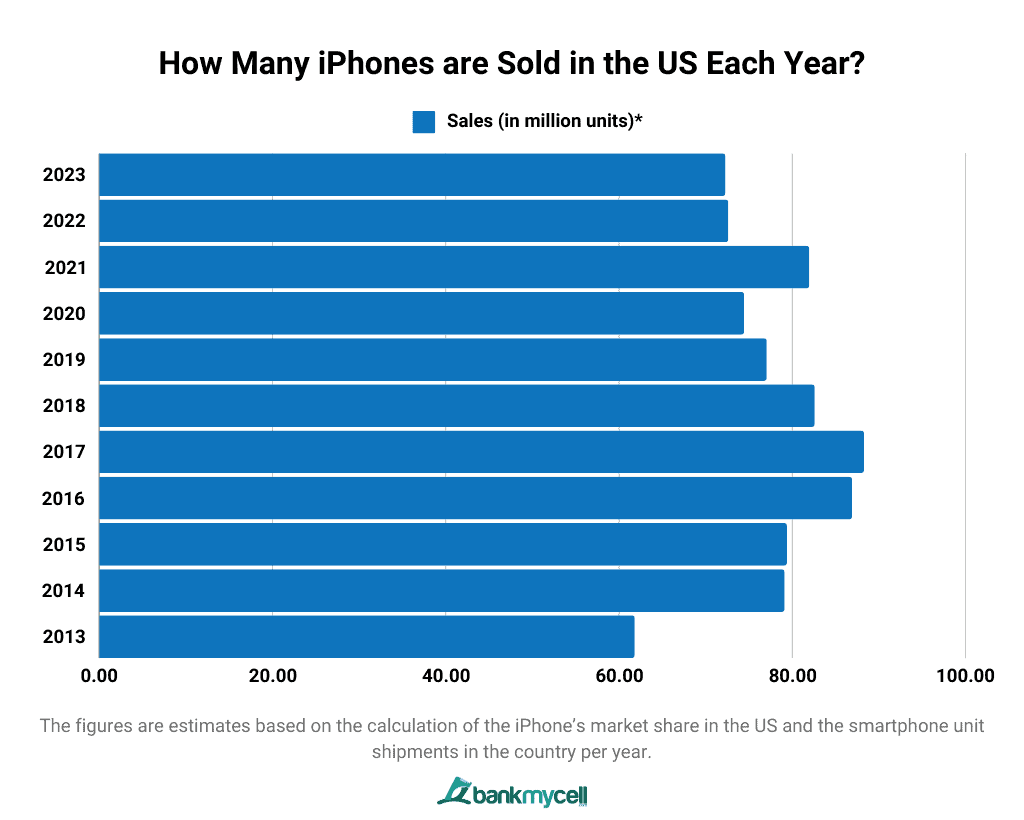
It is estimated that around 72.28 million iPhones were shipped and sold in the US in 2023. With 124 million smartphone shipments in the US for the year, Apple’s iPhone achieved 58% market share of the total sales of smartphone manufacturers in the country.
How Many iPhones are Sold in the US Each Year? (2015-2024)
Annual iPhone Sales in the United States
| Year | Sales (in million units)* |
|---|---|
| 2023 | 72.28 |
| 2022 | 72.62 |
| 2021 | 81.96 |
| 2020 | 74.45 |
| 2019 | 77.06 |
| 2018 | 82.59 |
| 2017 | 88.28 |
| 2016 | 86.91 |
| 2015 | 79.39 |
| 2014 | 79.12 |
| 2013 | 61.82 |
*Note: The figures are estimates based on the calculation of the iPhone’s market share in the US and the smartphone unit shipments in the country per year.

- Data Table
-
Annual iPhone Sales in the United States
Year Sales (in million units)* 2023 72.28 2022 72.62 2021 81.96 2020 74.45 2019 77.06 2018 82.59 2017 88.28 2016 86.91 2015 79.39 2014 79.12 2013 61.82 *Note: The figures are estimates based on the calculation of the iPhone’s market share in the US and the smartphone unit shipments in the country per year.
- Data Graphic
-

Apple’s iPhone has constantly shown its dominance in the US market. In recent years, the country alone has taken more than 30% of iPhone’s total sales and shipments worldwide.
Key Stats:
- The release of the Apple iPhone 12 was delayed from September to October due to a global semiconductor shortage. A sudden increase in demand for electronics during the COVID-19 pandemic and the tech war between the US and China caused it.
- Since 2007, there has been an Apple iPhone model released every year.
- Apple made several strategic moves for its phones to prevent iPhone sales from stagnating, such as the release of the iPhone SE. The phone’s 4-inch screen was intended to boost the iPhone’s market share because Apple discovered that a large number of iPhone users haven’t upgraded to larger iPhone models. The company also discovered that 4-inch phones are top-rated in developing countries.
iPhone Market Share in the US
As of the first quarter of 2024, Apple continues to remain at the top of the US market by achieving a 59% market share. Other leading smartphone vendors worldwide, such as Samsung and their Samsung Galaxy line, could never quite compete with iPhone sales in the country. Apple remains ahead of its competitors as the manufacturer with the highest smartphone market share.
Apple sales statistics show that in the past ten years or so, more than half of all smartphones sold in the US are from Apple.
Key Stats:
- For 2022, Apple achieved its highest market share in the US, with 58.5%.
- For 2021, Apple’s market share peaked in the first quarter at 60.73%.
- In 2020, Apple’s market share was highest in the fourth quarter, with 60.85%.
- Steve Jobs and Steve Wozniak co-founded Apple in 1976, and it currently has the highest market capitalization in the world at 2.533 trillion USD.