How Many People Play Video Games in the World? (2025)


Worldwide Gamers Statistics: User Numbers, Demographics, & Region
There are 1.31 billion active gamers in 2024, which means that about 16.35% of the world’s population play video games. This is expected to grow to 17.7% in 2027, or up to 1.47 billion gamers worldwide. Similarly, this year’s estimated global video gaming revenue of $455.27 billion is expected to grow by 37.42% more or up to $625.64 billion market revenue in 2028. This data shows that the video gaming industry continues to expand and reach a wider audience even after the pandemic.
Video games have become so widespread in our lives that even adults enjoy them. Video game players can play on gaming consoles, mobile devices, PC, and more for entertainment or in their free time.
So, who are the people who are more likely to be gamers? Read on to find out the gaming stats, which include gamer demographics, average gamer’s age, how many gamers are there worldwide, how many hours they prefer playing, and more.
Editors Picks:
- How Many People Play Video Games: In 2024, there are expected to be 1.31 billion gamers in the entire world. It is anticipated to grow 12% more by 2027 to a total of 1.47 billion players.
- Number of gamers in the US: Around 209.8 million Americans play video games, accounting for 65% or around two-thirds of the population in the country.
- User Penetration: The average gaming penetration among internet users worldwide is 81.9%, which means that around eight out of 10 internet users play games. The top five countries are Philippines (95.8%), Indonesia (94.8%), Vietnam (93.1%), Thailand (93.0%), and Turkey (92.3%).
- Top Country: China has the most video gamers in the world, with 742.19 million players. China’s gaming market generated $94.49 billion in revenue in 2024.
- Most Popular Game: The top best-selling video game of all time is Tetris, with 520 million copies sold. It is followed by Minecraft (238 million), Grand Theft Auto (175 million), Wii Sports (82.9 million), and PUBG (75 million).
- Top Region: Given that Asia Pacific has the most people who play video games (4.7 billion), it stands to reason that it has the most people who play video games, with a 55% share.
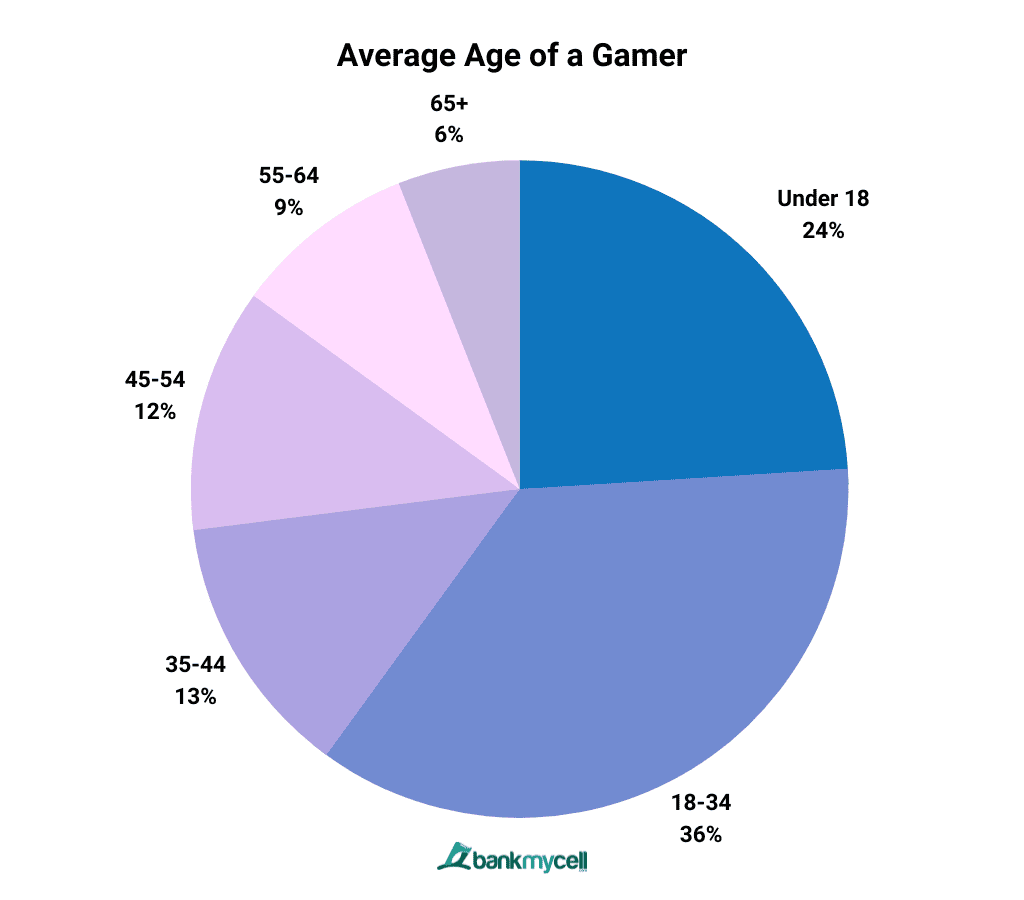
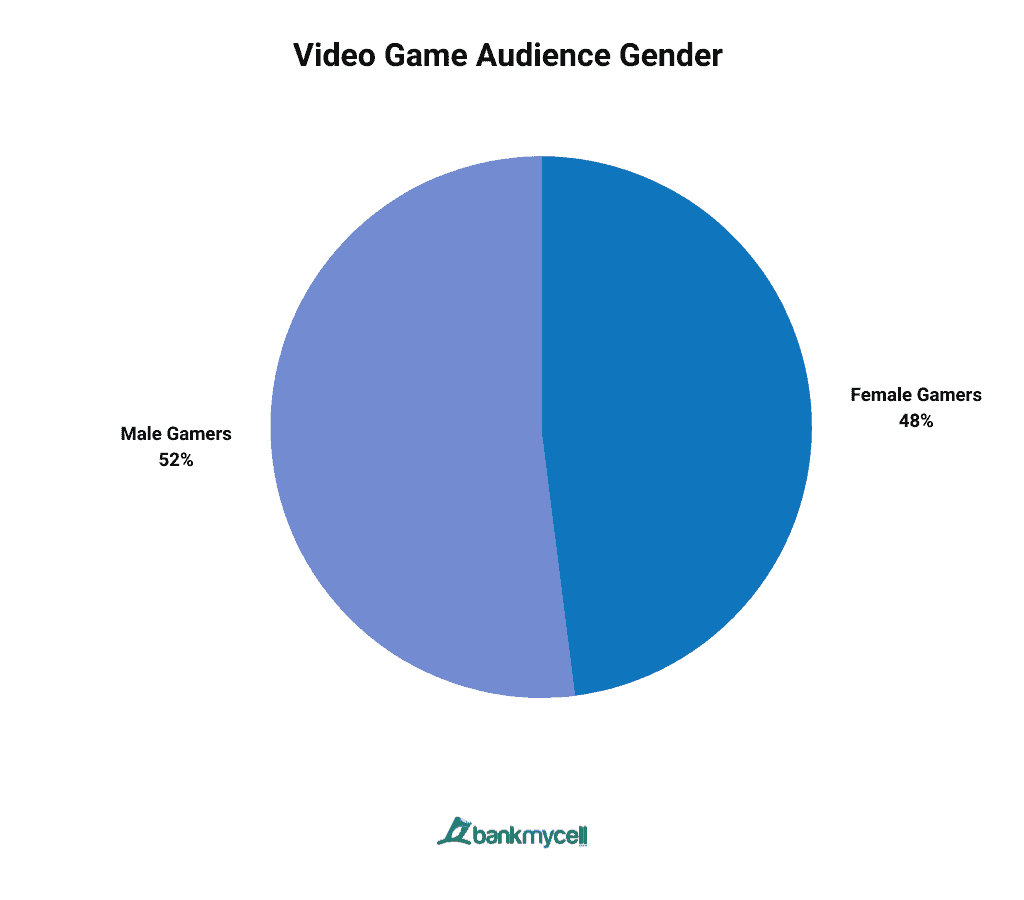
- Gamer Demographics: The average gamer is more likely to be an adult, with 36% of most gamers aged 18 to 34. Only around 24% of players are under 18. The ratio of male to female gamers is essentially equal, with males accounting for 52% and females at 48%.
- Average Gaming Time Worldwide: The worldwide average time spent on games is 8.45 hours per week. An average binge-gaming session, however, can last 5.1 hours. China’s gamers spend the most time playing video games, with an average of 12.39 hours per week.
- Average Gaming Time in the US: The average video gaming time spent in the United States is 7.71 hours per week. The US average for binge gaming runs a little high compared to the world average, with 5.9 hours.
In this Article:
- Number of Gamers in the World
- How Many People Play Video Games in the US
- Top Countries by Gaming Penetration
- Gamer Share Worldwide by Region
- Most Popular Game in the World
- Most Played Games of All-Time
- Gamer Demographics: Age, Gender & Ethnicity
- Global Average Time Playing Video Games
- Average Time Playing Video Games By Country
- Average Time Playing Video Games By Gender Globally
- Average Time Playing Video Games By Age in the US
How Many People Play Video Games in the World Today
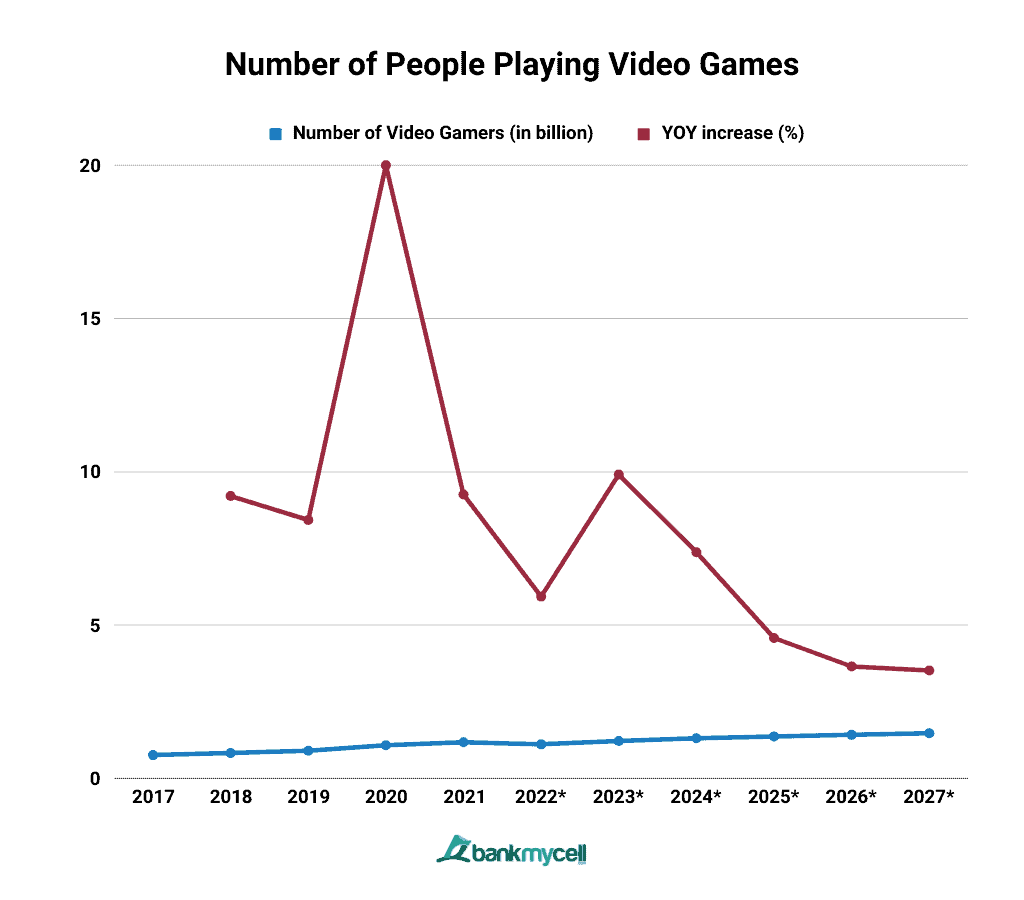
There are an estimated 1.31 billion video gamers globally this 2024, a 7.38% increase from the previous year. The number of gamers is expected to grow to 1.47 billion by 2027 (a 12% increase from this year), with about 100 million new players joining. The COVID-19 pandemic in 2020 saw the highest year-on-year growth in the number of players, with a 20% increase in the number of gamers compared to 2019.
In addition, 2.5 billion video gamers will spend their money purchasing digital games in 2022. It has been rising since 2017 and is forecast to continue accelerating until 2027.
Forecast: How Many People Will Play Video Games 2017-2027
Number of People Playing Video Games in 2017 to 2027
| Year | Number of Video Gamers (in billion) | YOY increase (%) |
|---|---|---|
| 2027* | 3.1 | 2.65 |
| 2026* | 3.02 | 3.07 |
| 2025* | 2.93 | 3.17 |
| 2024* | 2.84 | 5.18 |
| 2023* | 2.7 | 7.14 |
| 2022* | 2.52 | -4.18 |
| 2021 | 2.63 | 7.79 |
| 2020 | 2.44 | 17.87 |
| 2019 | 2.07 | 9.52 |
| 2018 | 1.89 | 7.99 |
| 2017 | 1.75 | - |
- Data Table
-
Number of People Playing Video Games in 2017 to 2027
Year Number of Video Gamers (in billion) YOY increase (%) 2027* 3.1 2.65 2026* 3.02 3.07 2025* 2.93 3.17 2024* 2.84 5.18 2023* 2.7 7.14 2022* 2.52 -4.18 2021 2.63 7.79 2020 2.44 17.87 2019 2.07 9.52 2018 1.89 7.99 2017 1.75 - - Data Graphic
-

A total of 1.31 billion people played video games in the world this year, a 7.38% increase compared to the previous year, which reached 1.22 billion. It is anticipated that 1.47 billion will play video games by 2027, which will mean a 12% user growth from 2024 to 2027.
In the survey done last Q3 2021, 83.6% of global internet users have played video games across any device. 68.1% preferred playing video games on their phones, followed by laptop or desktop computers, with 36.8%. The game console became the third most popular device with 25.8%.
Number of Gamers By Country & Region 2024
How Many People Play Video Games in the US
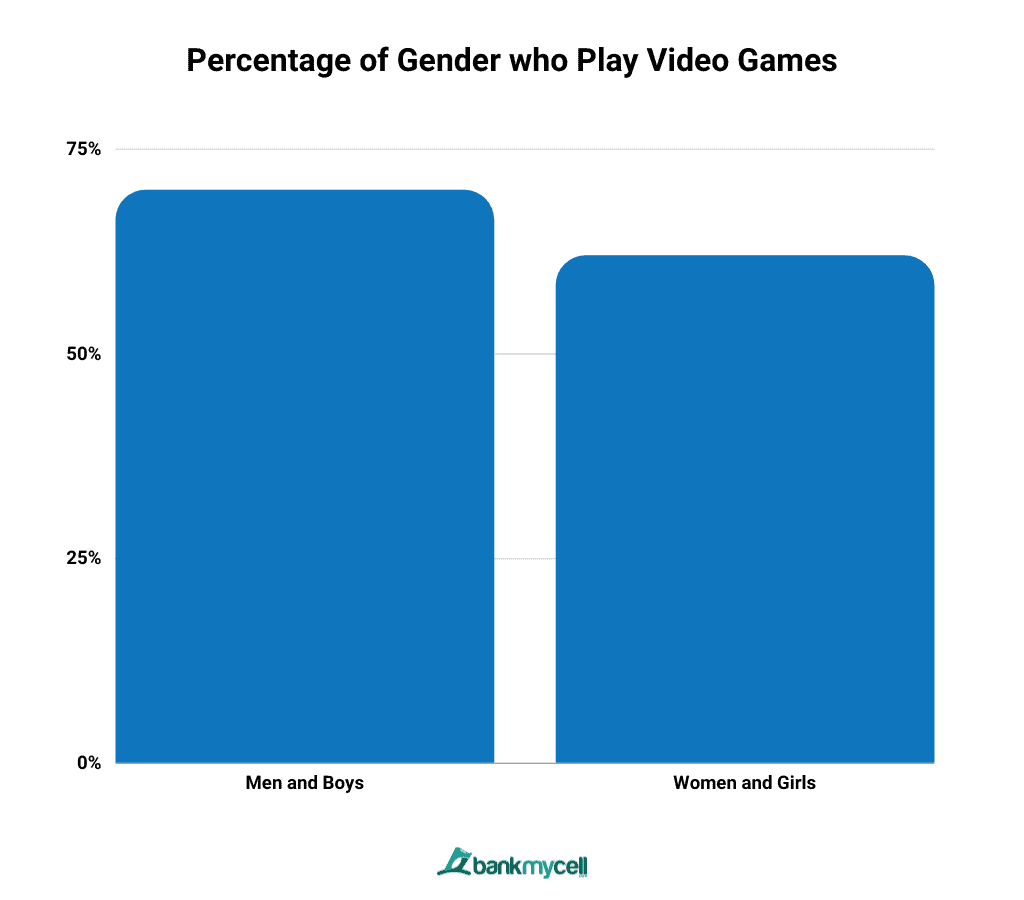
Around 209.8 million Americans play games, which is approximately two-thirds of the country’s population. The average gamer in the US is an adult and is about as likely to be female (48%) than male (58%). Statistics show that 70% of men and boys in America played video games, as did 62% of women and girls in the country.
American adults play video games mostly to use their brains, consider it as their personal time, and help improve themselves. The younger ones, who are 18 to 24 years old, prefer to play games for connection, entertainment, and comfort.
What Percentage of Americans Play Video Games
Around 65% of people in the US play games, with about 66% of them playing at least once a week. According to a survey by Entertainment Software Association, most American players are adults, with 65% of American video gamers aged 18 and over. Specifically, the age groups include under 18 years old (24%), 18 to 34 years old (36%), 35 to 44 years old (13%), 45 to 54 years old (12%), 55 to 64 years old (9%), 65 and older (6%). The average age of an American gamer is 33 years old.
In this section, you will learn about the top countries by gaming penetration and the leading markets and regions by revenue in the video game industry.
Worldwide Gaming Revenue
China has the highest number of video gamers worldwide, with 699.6 million players in 2024. It is also the biggest video game market this year and is expected to generate $94.49 billion US dollars in revenue. The United States is the second biggest market, with $78.01 billion in revenue and 209.8 million gamers in the country.
These two countries are the biggest gaming markets in the world. The number of gamers here is growing for a variety of reasons. Most Chinese gamers play to pass the time, whereas American gamers play to escape daily life. Their goals in playing differ due to differences in gaming styles and play experiences between the Western and Eastern markets
Gaming Penetration by Country
Top Countries by Gaming Penetration
| Country | Gaming Penetration (%) |
|---|---|
| Philippines | 95.8 |
| Indonesia | 94.8 |
| Vietnam | 93.1 |
| Thailand | 93 |
| Turkey | 92.3 |
| India | 91.9 |
| Mexico | 91.3 |
| Taiwan | 91.6 |
| Saudi Arabia | 90.1 |
| South Africa | 89.7 |
| Brazil | 88.4 |
| UAE | 88.2 |
| Chile | 87.6 |
| Malaysia | 87.4 |
| Greece | 86.3 |
| Colombia | 84.8 |
| Portugal | 84.7 |
| Egypt | 83.4 |
| Romania | 83.3 |
| Hong Kong | 83.1 |
| United States | 82.9 |
- Data Table
-
Country Gaming Penetration (%) Philippines 95.8 Indonesia 94.8 Vietnam 93.1 Thailand 93 Turkey 92.3 India 91.9 Mexico 91.3 Taiwan 91.6 Saudi Arabia 90.1 South Africa 89.7 Brazil 88.4 UAE 88.2 Chile 87.6 Malaysia 87.4 Greece 86.3 Colombia 84.8 Portugal 84.7 Egypt 83.4 Romania 83.3 Hong Kong 83.1 United States 82.9 - Data Graphic
-

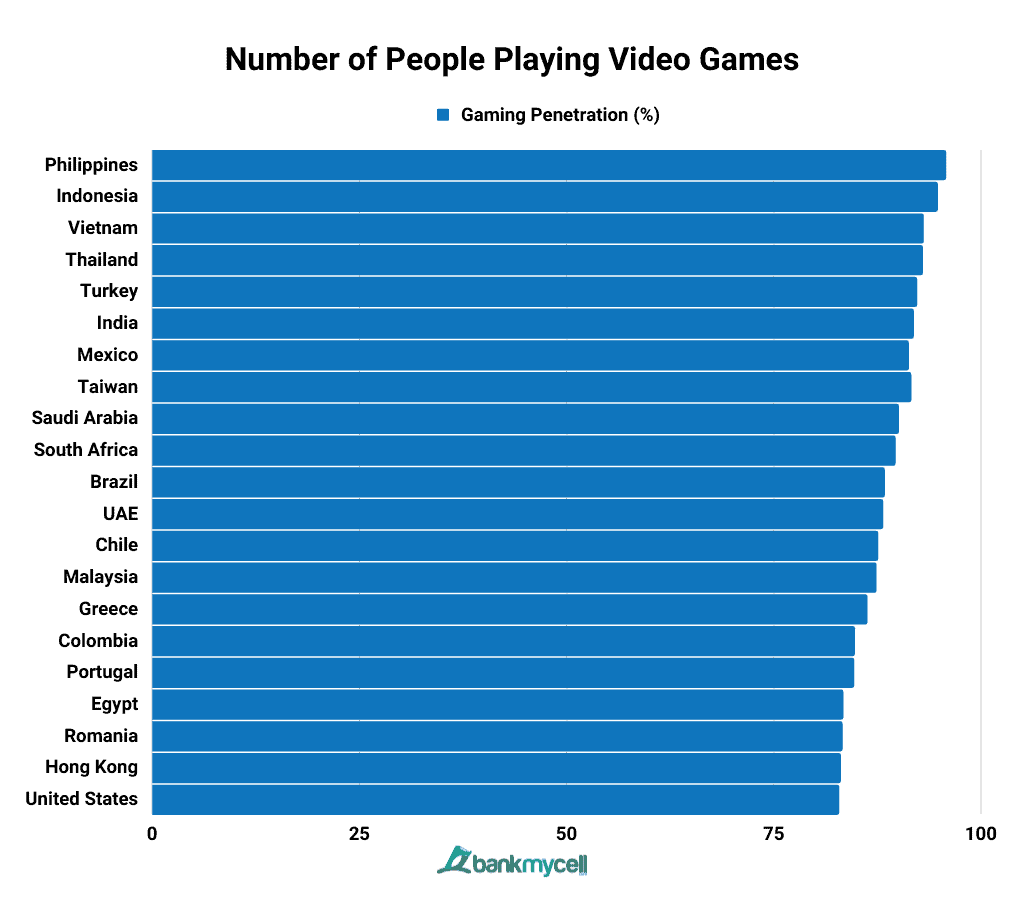
More than 80% global share of internet users are playing games across any device such as a smartphone, console, or computer. The Philippines has the most significant share of gaming usage, with a 95.8% user penetration among its internet users. Indonesia came in second place with 94.8% gaming penetration, and Vietnam was third with 93.1%. The worldwide average gaming penetration is 81.9%.
Filipino online gamers are certainly hooked on free-to-play games. They prefer daily playing Subway Surfers, Mobile Legends: Bang Bang, and Roblox on mobile devices. The majority usually spend 1 to 7 hours of mobile gaming, and they like role-playing genre games.
Gamer Share by World Region
Regional Distribution of Video Gamers
| Country | Video Gamers Share |
|---|---|
| Asia Pacific | 55% |
| Middle East & Africa | 15% |
| Europe | 14% |
| Latin America | 10% |
| North America | 7% |
- Data Table
-
Country Video Gamers Share Asia Pacific 55% Middle East & Africa 15% Europe 14% Latin America 10% North America 7% - Data Graphic
-

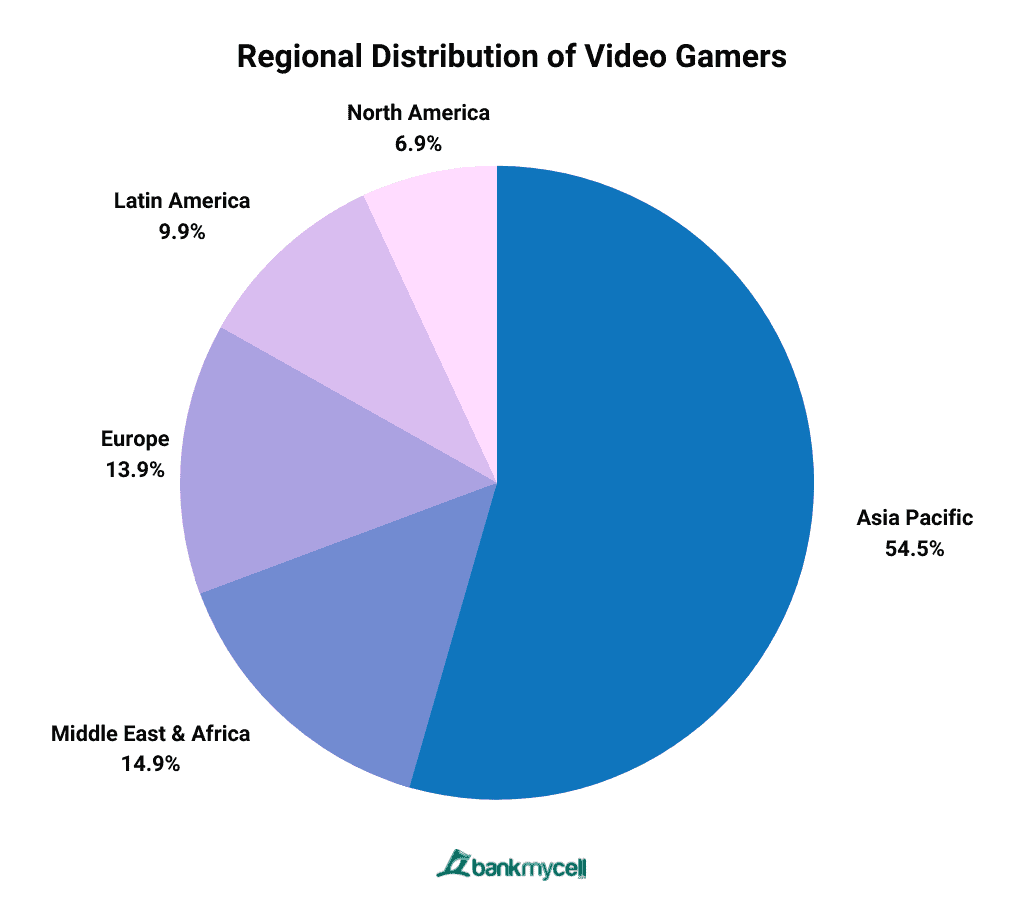
Asia is leading the regional gaming market with a 55% gamer share. Having the largest population of 4.7 billion among the countries, it makes sense that Asia Pacific has the most people who play video games. This continent also has many video game companies, with China dominating the gaming revenue market.
Key Stats:
- The Asia Pacific region has 4.7 billion people, with video gamers accounting for 55% (2.5 billion).
- There are 1.4 billion people in Africa, with video gamers accounting for 15% (213 million).
- Europe has 748 million people, with video gamers accounting for 14% (104 million) of the population.
- Latin America and the Caribbean have a population of 668 million, with video gamers accounting for 10% (66 million) of the total.
- The population of North America is 374 million people, with video gamers accounting for 7% (26 million) of the total.
What is the Most Popular Game in the World?
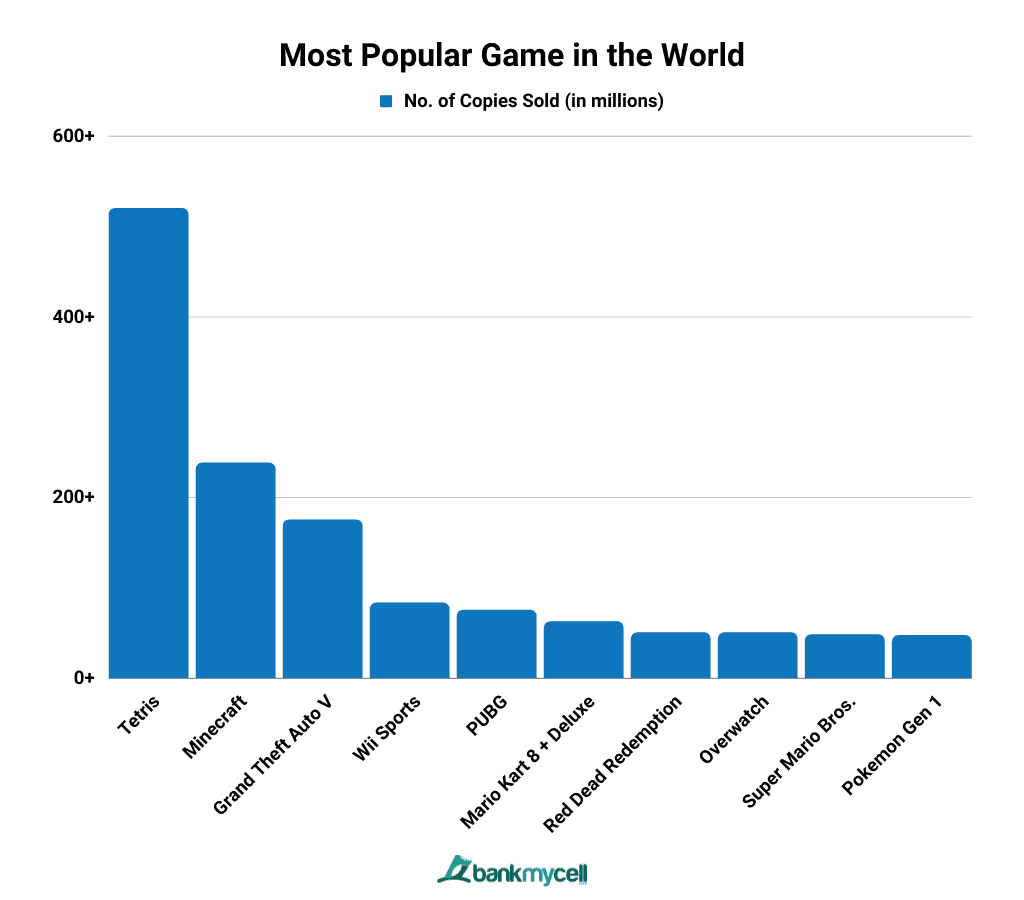
The top best-selling video game of all time is Tetris, with 520 million copies sold. The game was initially released in 2006 but has since been transformed into multiple variations made for over 50 gaming platforms.
Most Played Games
| Video Game | No. of Copies Sold (in millions) |
|---|---|
| Tetris | 520 |
| Minecraft | 238 |
| Grand Theft Auto V | 175 |
| Wii Sports | 82.9 |
| PUBG | 75 |
| Mario Kart 8 + Deluxe | 62.25 |
| Red Dead Redemption | 50+ |
| Overwatch | 50 |
| Super Mario Bros. | 48 |
| Pokemon Gen 1 | 47 |
- Data Table
-
Video Game No. of Copies Sold (in millions) Tetris 520 Minecraft 238 Grand Theft Auto V 175 Wii Sports 82.9 PUBG 75 Mario Kart 8 + Deluxe 62.25 Red Dead Redemption 50+ Overwatch 50 Super Mario Bros. 48 Pokemon Gen 1 47 - Data Graphic
-

The top three most played games in the world are Tetris with 520 million video game sales, Minecraft with 238 million, and Grand Theft Auto with 175 million.
When it comes to devices, 70% prefer mobile gaming on smartphones, 52% on gaming consoles, 43% on PC, 26% on tablets, and 7% on VR devices. Furthermore, 60% play games on multiple devices.
Gaming Demographics: Video Game Players by Age & Gender
The average gamer plays games every week. Contrary to popular belief, a video game player is more likely to be an adult, and the ratio of male gamers to female gamers is close to 50:50.
In the video game industry, there is no such thing as an appropriate age or gender. Everyone has the right to play video games, regardless of who or where they are, because it connects people, creates bonds, and promotes diversity around the globe.
In this section, you will learn about US gamer demographics, such as age group, gender, and ethnicity.
Gamer Share by Age Group
| Age Group | User Share |
|---|---|
| Under 18 | 24% |
| 18-34 | 36% |
| 35-44 | 13% |
| 45-54 | 12% |
| 55-64 | 9% |
| 65+ | 6% |
- Data Table
-
Age Group User Share Under 18 24% 18-34 36% 35-44 13% 45-54 12% 55-64 9% 65+ 6% - Data Graphic
-

The average age of a US video gamer is 33 years old. In America, people between 18 and 34 play the most video games (36%), followed by those under 18 (24%) in 2022. The most dominant age demographic is primarily millennials and members of Generation X.
In addition, 69% of American households have at least one person that plays video games. Around 77% of parents play video games at least one hour per week playing video games with their children, a 3% increase from 2021, for the following reasons: it is fun for them, it allows them to spend time together, it will enable them to socialize with their kids, and some kids ask them to.
Gamer Share by Gender
| Sex | User Share |
|---|---|
| Male | 52% |
| Female | 48% |
- Data Table
-
Sex User Share Male 52% Female 48% - Data Graphic
-

Around 48% of the 215.5 million active video game players are females, with males accounting for the remaining 52% of gamers in the United States. This sets an almost equal ratio between the two sexes when it comes to gaming tendencies.
Percentage of Gamers in a Gender Group
| Sex | Percentage of Gender Group Who Play Video Games |
|---|---|
| Men and Boys | 70% |
| Women and Girls | 62% |
- Data Table
-
Sex Percentage of Gender Group Who Play Video Games Men and Boys 70% Women and Girls 62% - Data Graphic
-

Out of all the men in boys in the United States, around 70% report that they play digital games. Similarly, around 62% of women and girls were the same.
Almost half of the gaming audience in the United States are female gamers. This trend has been ongoing for several years. While women are under-represented in-game media and the industry, they account for a sizable portion of gamers and spending power.
Gamer Demographics by Ethnicity in the US
| Ethnicity | Video Game Player Share |
|---|---|
| White | 71% |
| Hispanic | 10% |
| Black/African American | 8% |
| Asian/Pacific Islander | 7% |
| Other | 3% |
- Data Table
-
Ethnicity Video Game Player Share White 71% Hispanic 10% Black/African American 8% Asian/Pacific Islander 7% Other 3% - Data Graphic
-

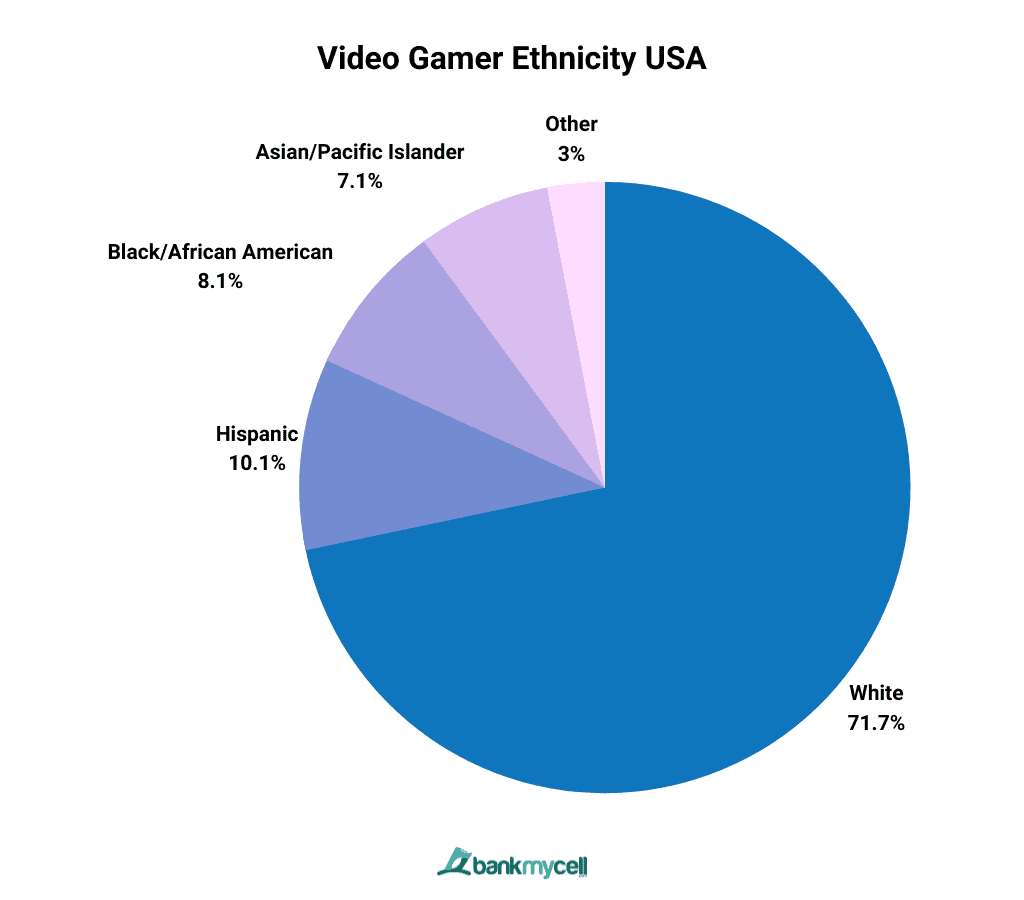
The majority of American gamers are White, with 71% identifying as such, followed by Hispanics, with 10%. Black/African Americans account for 8% of video game players, while Asian/Pacific accounts for 7%
Average Time Playing Video Games
The average video gaming time spent in the US is 7.71 hours each week. The global average is at 8.45 hours. Around 25% of that time is spent by gamers playing online multiplayer games, while in-person multiplayer games consume 16%. To summarize, 41% of the time is spent playing with others.
The average binge-gaming session worldwide, however, can last 5.1 hours. The US average runs a little high compared to the world average, with 5.9 hours. (Source: Statista)
How Many Hours do Gamers Play a Day/Week/Month
- Gaming Hours Per Day: Gamers spend 1.2 hours a day playing video games.
- Gaming Hours Per Week: The weekly average for video game time is 8.45 hours.
- Gaming Hours Per Month: Gamers spend an average of 33.8 hours per month playing video games.
- Gaming Hours Per Year: On average, gamers spend 439.4 hours per year video gaming.
Average Time Playing Video Games By Country
| Country | Average Weekly Hours Spent |
|---|---|
| China | 12.39 |
| Vietnam | 10.16 |
| India | 8.61 |
| Indonesia | 8.54 |
| Global | 8.45 |
| United States | 7.71 |
| United Kingdom | 7.17 |
| Germany | 7.13 |
| South Korea | 5.88 |
- Data Table
-
Country Average Weekly Hours Spent China 12.39 Vietnam 10.16 India 8.61 Indonesia 8.54 Global 8.45 United States 7.71 United Kingdom 7.17 Germany 7.13 South Korea 5.88 - Data Graphic
-

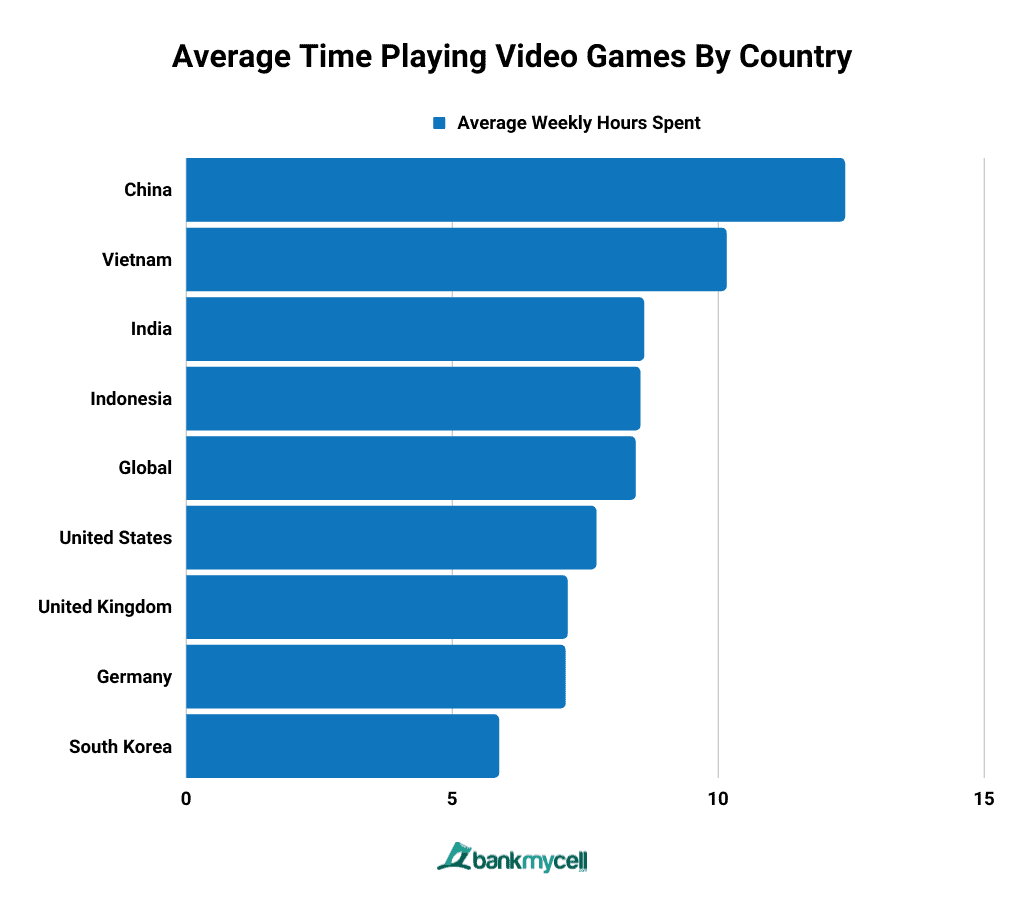
China’s population plays video games for the longest time, with 12.39 average hours spent every week in 2021. Vietnamese came in second place, video gaming for about 10.16 hours per week. Meanwhile, the US is in 6th, with 7.71 average weekly hours. The global average for weekly gaming hours is 8.45.
Average Time Playing Video Games By Gender
| Gaming Time | Female | Male | All |
|---|---|---|---|
| Less than 1 hour a week | 9.70% | 9.80% | 9.80% |
| 1-2 hours a week | 14.00% | 14.50% | 14.30% |
| 2-4 hours a week | 16.60% | 15.40% | 16.00% |
| 4-7 hours a week | 16.40% | 16.10% | 16.20% |
| 7-12 hours a week | 18.50% | 19.00% | 18.80% |
| 12-20 hours a week | 13.90% | 13.40% | 13.70% |
| More than 20 hours a week | 10.90% | 11.90% | 11.40% |
- Data Table
-
Gaming Time Female Male All Less than 1 hour a week 9.70% 9.80% 9.80% 1-2 hours a week 14.00% 14.50% 14.30% 2-4 hours a week 16.60% 15.40% 16.00% 4-7 hours a week 16.40% 16.10% 16.20% 7-12 hours a week 18.50% 19.00% 18.80% 12-20 hours a week 13.90% 13.40% 13.70% More than 20 hours a week 10.90% 11.90% 11.40% - Data Graphic
-

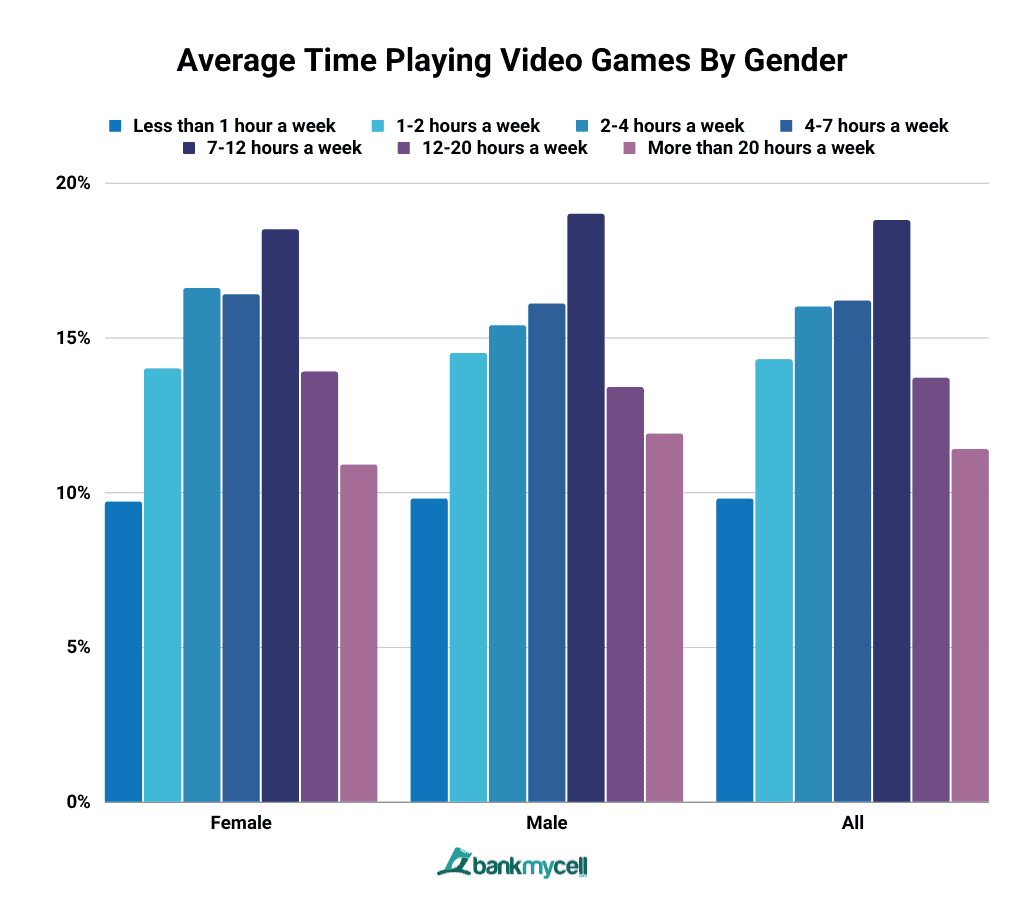
According to a Statista report from January 2021, 19% of males and 18.50% of females play video games for 7 to 12 hours per week. 10.90% of women and 11.90% of men spend more than 20 hours per week playing video games. The weekly average for gaming time was 8.45 hours.
In the eSports sector, 15% of male players and 3% of female gamers are avid fans, in the gaming statistics conducted in September 2021. In recent years, eSports has become a significant part of the entertainment industry. Players can compete in multiplayer video game tournaments worldwide, individually or in teams.
Average Time Playing Video Games By Age USA
| Age Group | Average Weekly Hours Spent |
|---|---|
| 15 to 24 years | 39 |
| 25 to 34 years | 19.8 |
| 35 to 44 years | 8.4 |
| 45 to 54 years | 6.6 |
| 55 to 64 years | 6 |
| 65 years and over | 13.2 |
| Total 15 years and over | 15.6 |
- Data Table
-
Age Group Average Weekly Hours Spent 15 to 24 years 39 25 to 34 years 19.8 35 to 44 years 8.4 45 to 54 years 6.6 55 to 64 years 6 65 years and over 13.2 Total 15 years and over 15.6 - Data Graphic
-

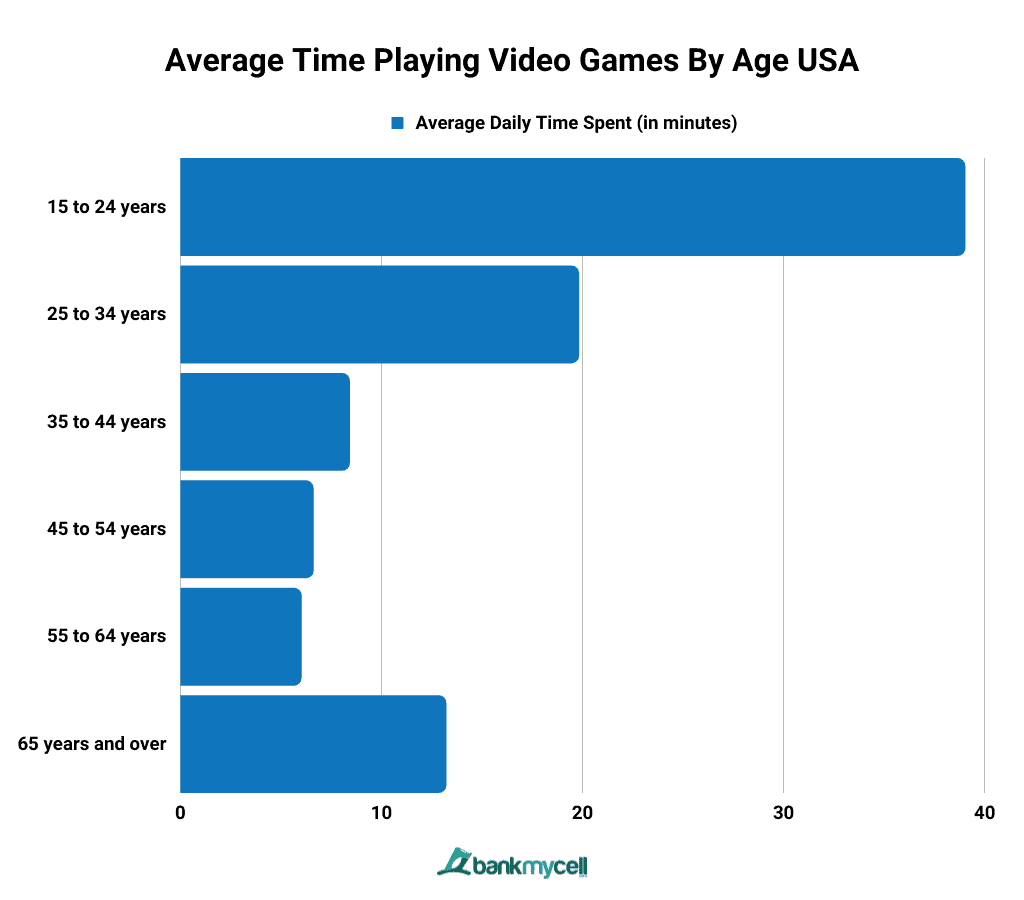
In the gaming world of 2019, people in the United States between the ages of 15 and 24 spent an average of 39 minutes per day playing games. Simultaneously, 25 to 34 years old spent 19.8 minutes a day video gaming. The average time spent on video games by people aged 15 and up is 15.60 hours.
Regardless of the gaming platform, roughly two-thirds of US gaming spenders were satisfied with their in-game purchases in 2021. The happiest are console gamers, with 67% reporting that their item purchases and virtual goods were very or somewhat satisfactory.