Number of iPhone Users in the World/USA (2026)


How Many People Have iPhones in 2024?
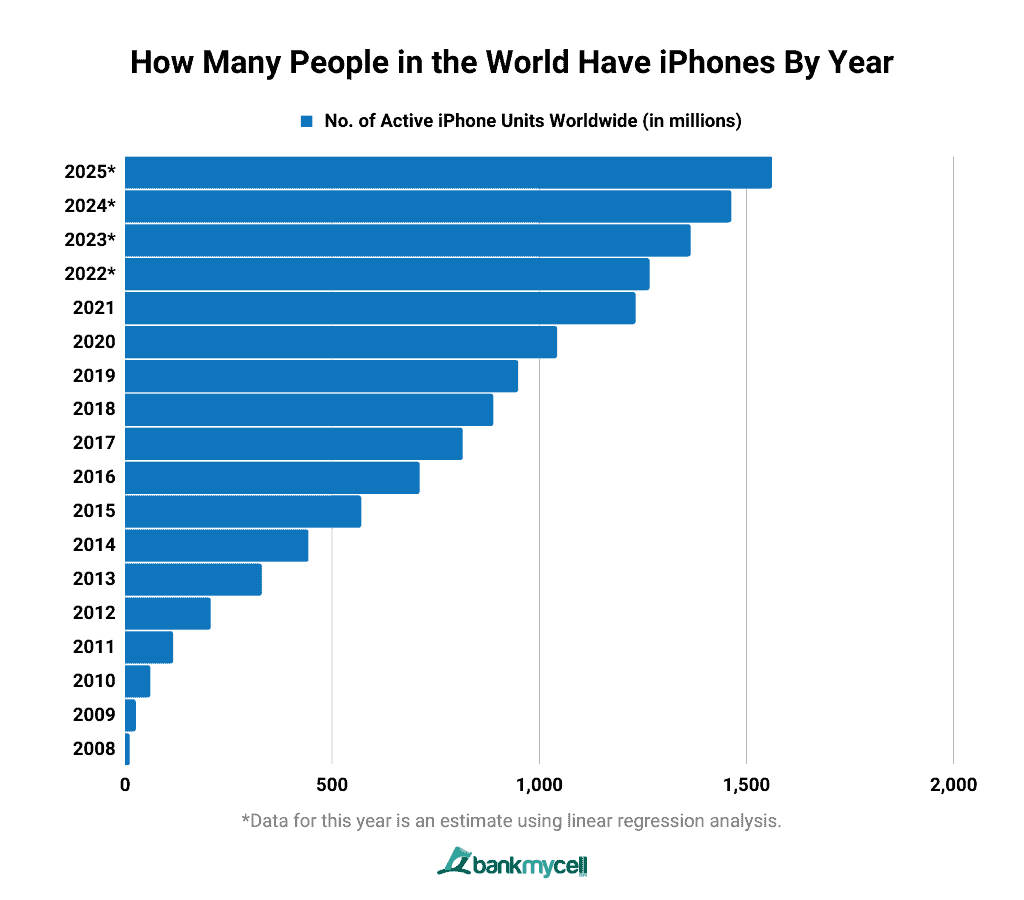
Approximately 1.46 billion people in the world use iPhones in 2024. This means that around 18% of the world’s population are iPhone users. There are around 143 million iPhone users in the United States in the same year, which make up more than 50% of the country’s population who uses smartphones.
Did you know that the iPhone is Apple’s main source of revenue, accounting for 50% of total global sales? Apple reached the billion-user mark in 2020, with 1.042 billion users worldwide, rising to 1.23 billion the following year. The number of iPhone users in the United States and worldwide has risen steadily over the years.
In this article, learn more about the growth of iPhone usage, iPhone market share, and how Apple remains one of the most valuable companies in the world in the smartphone industry.
Editors Picks:
- How many people have iPhones (Global): There will be approximately 1.46 billion iPhone users worldwide in 2024.
- How many people have iPhones (US): There will be around 143 million iPhone users in the United States in 2024.
- What percent of people have iPhones? (Global): Out of the 8.088 billion people in the world in 2024, around 18% use Apple’s iPhone.
- What percentage of Americans have iPhones? (US): More than 50% of Americans who have smartphones use iPhones.
- iPhone Market Share: Latest data shows that Apple took the top spot for the largest smartphone market share globally at 29.19% as of January 2024. Samsung is in second place with 24.48%. In the US, Apple also takes the top spot, with a market share of 58.66%.
How Many iPhone Users Are There in the World?
It is estimated that there will be approximately 1.46 billion people who will be using iPhones worldwide in 2024. Around 150 million iPhone units were sold in 2022 alone.
How Many People in the World Have iPhones By Year (2008-2025)
No. of Active Apple iPhone Units Worldwide
| Year | No. of Active iPhone Units Worldwide (in millions) |
|---|---|
| 2025* | 1561 |
| 2024* | 1462 |
| 2023* | 1364 |
| 2022* | 1265 |
| 2021 | 1231 |
| 2020 | 1042 |
| 2019 | 948 |
| 2018 | 888 |
| 2017 | 814 |
| 2016 | 710 |
| 2015 | 569 |
| 2014 | 442 |
| 2013 | 329 |
| 2012 | 206 |
| 2011 | 115 |
| 2010 | 60 |
| 2009 | 25 |
| 2008 | 10 |

- Data Table
-
No. of Active Apple iPhone Units Worldwide
Year No. of Active iPhone Units Worldwide (in millions) 2025* 1561 2024* 1462 2023* 1364 2022* 1265 2021 1231 2020 1042 2019 948 2018 888 2017 814 2016 710 2015 569 2014 442 2013 329 2012 206 2011 115 2010 60 2009 25 2008 10 - Data Graphic
-

*Note: Data for this year is an estimate using linear regression analysis.
Key Stats:
- The number of iPhone users is expected to grow to 1.56 billion people by 2025.
- Apple’s global user base surpassed 100 million in 2011 when it recorded additional 55 million users added from 2010.
- Apple reached the billion-user mark in 2020 with 1.042 billion users worldwide and increased to 1.23 billion the following year.
- The iPhone is Apple’s primary source of revenue, accounting for roughly half of the company’s global sales.
- A spokesperson told The Verge that Apple deems a device active if it has used an Apple service in the previous 90 days.
- According to analysts, even though fewer iPhones are sold each year, people clearly keep them for a long time.
What Percentage of People Have iPhones?
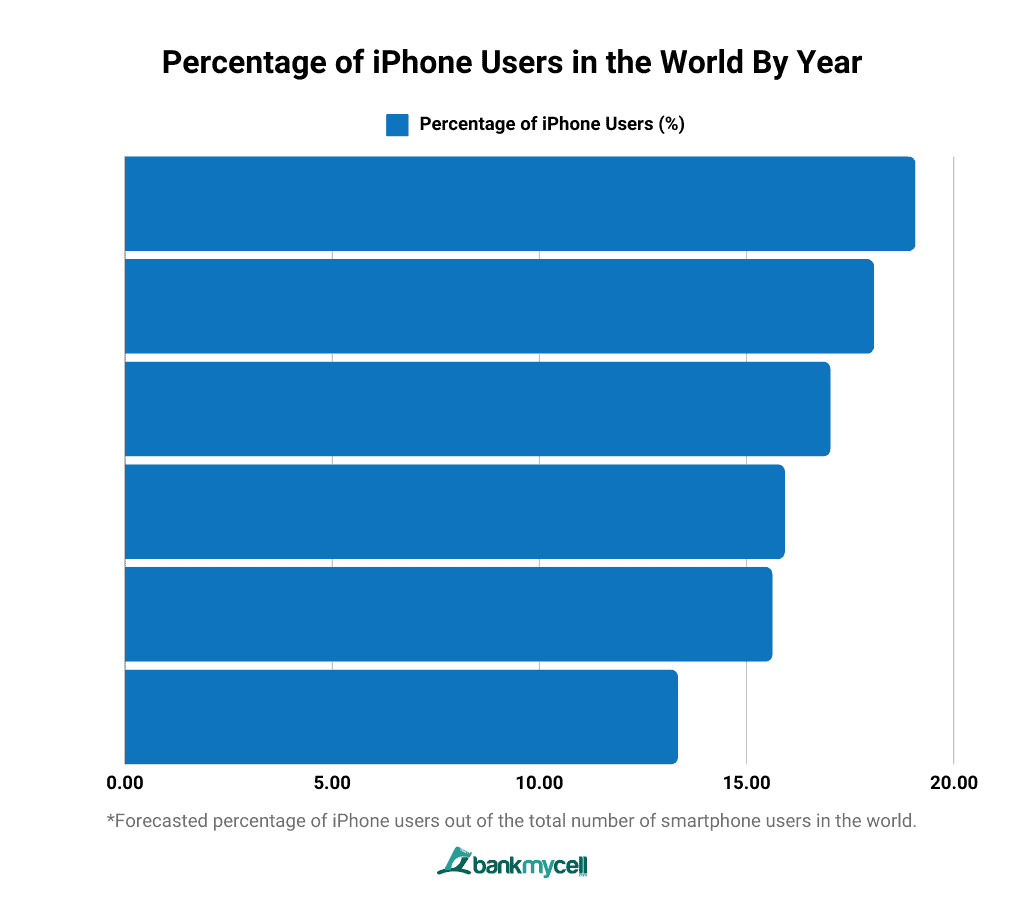
iPhone users account for approximately 30%, or 1.46 billion people, out of all smartphone users worldwide at 4.88 billion in 2024. The number of iPhone users make up around 18% of the worldwide population this year.
Percentage of iPhone Users in the World By Year (2020-2025)
Yearly Percentage of iPhone Users Worldwide
| Year | Percentage of iPhone Users (%) |
|---|---|
| 2025* | 19.08 |
| 2024* | 18.08 |
| 2023* | 17.03 |
| 2022* | 15.93 |
| 2021 | 15.63 |
| 2020 | 13.35 |

- Data Table
-
Yearly Percentage of iPhone Users Worldwide
Year Percentage of iPhone Users (%) 2025* 19.08 2024* 18.08 2023* 17.03 2022* 15.93 2021 15.63 2020 13.35 - Data Graphic
-

*Note: Forecasted percentage of iPhone users out of the total global population.
It is estimated that around 20% of the 8.18 billion people in the world in 2025 will be using iPhones. This translates to around 1.56 billion iPhone users.
Market Share of iPhone Worldwide
The latest data shows that Apple has the largest global market share of 29% as of January 2024. Samsung closely trails Apple in second place with 25% market share.
How Many iPhone Users in the US in 2024
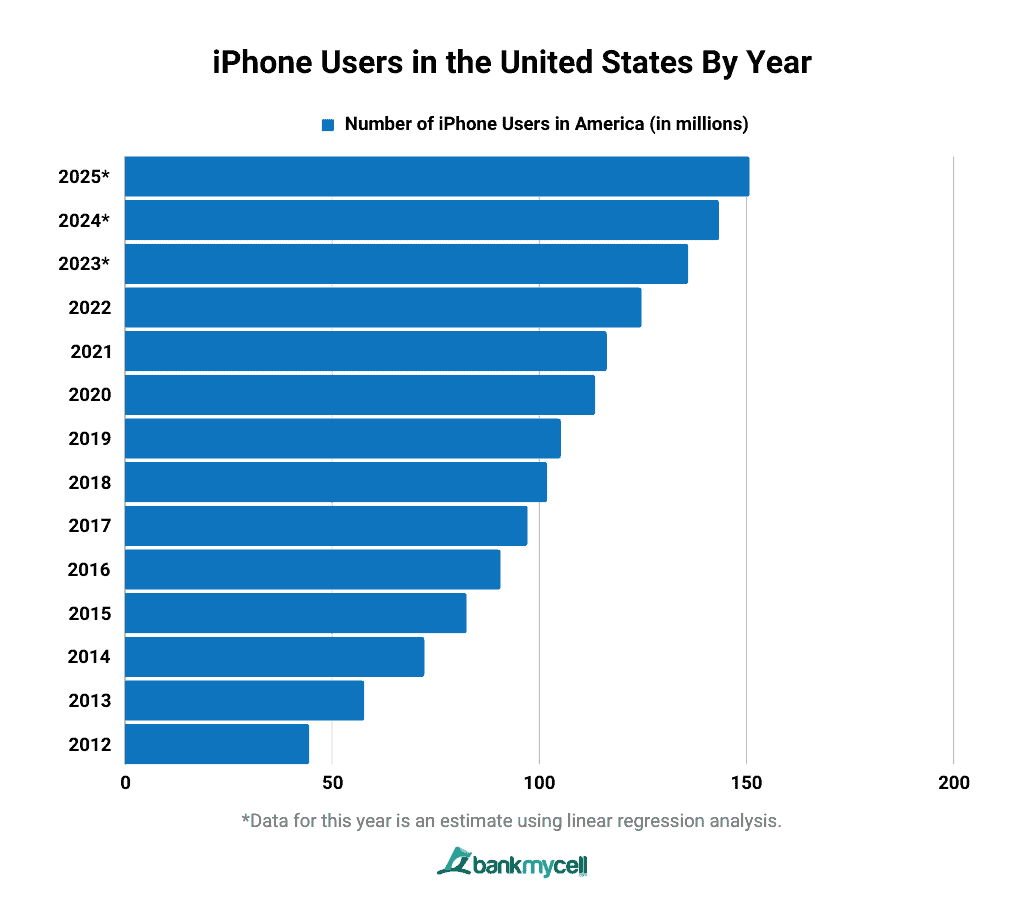
Out of the 341 million people in the US, 135.97 million people are using iPhones, or around 40% of the country’s population.
iPhone Users in the United States By Year (2012-2025)
Number of Apple iPhone Users in the United States (2012-2024)
| Year | Number of iPhone Users in America (in millions) |
|---|---|
| 2025* | 150.79 |
| 2024* | 143.38 |
| 2023* | 135.97 |
| 2022 | 124.7 |
| 2021 | 116.3 |
| 2020 | 113.5 |
| 2019 | 105.2 |
| 2018 | 101.9 |
| 2017 | 97.2 |
| 2016 | 90.7 |
| 2015 | 82.5 |
| 2014 | 72.3 |
| 2013 | 57.8 |
| 2012 | 44.53 |

- Data Table
-
Number of Apple iPhone Users in the United States (2012-2024)
Year Number of iPhone Users in America (in millions) 2025* 150.79 2024* 143.38 2023* 135.97 2022 124.7 2021 116.3 2020 113.5 2019 105.2 2018 101.9 2017 97.2 2016 90.7 2015 82.5 2014 72.3 2013 57.8 2012 44.53 - Data Graphic
-

*Note: Data for this year is an estimate using linear regression analysis.
It is projected that there will be 143.38 million Apple iPhone users in the United States in 2024, which is 7.417 million more users than in 2023.
Key Stats:
- More than two million new Apple iPhone users were added in 2020 from the previous year, followed by an additional eight million the following year.
- Apple’s revenue continues to rise year after year as the number of users increases. Figures in the more recent years are attributed in part to the company’s price cuts on older smartphone models and the exit of Huawei, a major competitor to the brand, in 2022.
- According to Statista, one of the reasons for the iPhone’s success is Apple’s ability to establish a dependable relationship with its clients. As a result, brand loyalty and customer satisfaction for iPhones have constantly been high in the US.
What Percentage of Americans Have an iPhone?
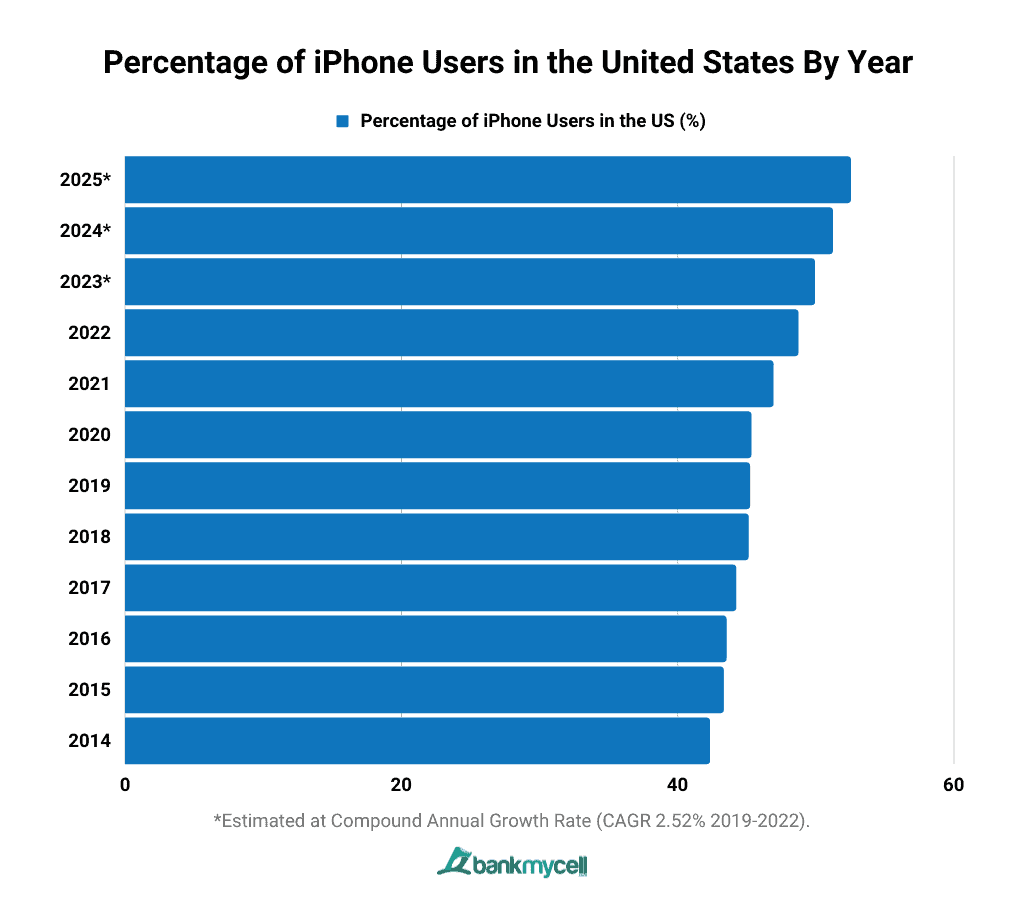
By 2024, around 51.2% of the total smartphone users in the United States own an iPhone. This is more than double the user market share of iPhone users globally at around 20%, validating the strong preference for Apple’s iPhones or Apple products in the US.
Percentage of iPhone Users in the United States By Year (2012-2025)
Total Percentage of iPhone Users in the United States (2012–2025)
| Year | Percentage of iPhone Users in the US (%) |
|---|---|
| 2025* | 52.5 |
| 2024* | 51.2 |
| 2023* | 49.9 |
| 2022 | 48.7 |
| 2021 | 46.9 |
| 2020 | 45.3 |
| 2019 | 45.2 |
| 2018 | 45.1 |
| 2017 | 44.2 |
| 2016 | 43.5 |
| 2015 | 43.3 |
| 2014 | 42.3 |

- Data Table
-
Total Percentage of iPhone Users in the United States (2012–2025)
Year Percentage of iPhone Users in the US (%) 2025* 52.5 2024* 51.2 2023* 49.9 2022 48.7 2021 46.9 2020 45.3 2019 45.2 2018 45.1 2017 44.2 2016 43.5 2015 43.3 2014 42.3 - Data Graphic
-

*Note: Estimated at Compound Annual Growth Rate (CAGR 2.52% 2019-2022).
The percentage of iPhone users to the total smartphone users in the US has consistently taken a significant 40-50% share for more than 10 years.
Market Share of iPhone in the US
Apple currently has a market share of around 60% in the US as of January 2023, making it the leading smartphone vendor in the country, followed by Android phones like Samsung and Motorola. It has a significant gap from its competitors, with an almost 35% lead from Samsung and a around 54% difference from Motorola.
Apple dominated the US premium smartphone market share in the second quarter of 2022, accounting for 57% of all revenue in the segment.
Demographics of Apple iPhone Users
Data from a 2019 Statista survey showed that female Apple iPhone users account for 51% of the total user base. In contrast, 43% are men, and 6% prefer not to reveal their gender.
Most iPhone users, or approximately 44% of the entire user community, are in the age group of 16 to 24. Around 34% of users are aged 25 to 34 years, followed by 35 to 44 years old at 13%. 45 and older are the smallest demographic, accounting for only 10% of all users.
It is clear that the vast majority of those who use iPhones are younger people, as around 78% of them are aged below 35 years old.
Percentage of iPhone Users vs. Android Worldwide
Out of the 8.088 billion population in the world in 2024, iPhone users make up 18.07%. Meanwhile, the user base of Android smartphones is much larger at around 48.22% of the global population.
Key Stats:
- Financial Times has reported that there has been a significant trend in Android users moving to iPhones over the last four years based on a Counterpoint research.
- The iPhone’s iOS has a 62.69% market share in Japan, but Android generally has a larger market share in Asian countries.
- The iPhone 7 is the most-used smartphone globally. According to Scientia Mobile’s user statistics, Apple takes the top six devices among the world’s most popular mobile phones. The iPhone 7 is currently followed by the iPhone X with 4.01%, iPhone 8 with 3.91%, the iPhone 6s with 3.68%, iPhone 8 Plus with 3.62%, and iPhone 7 Plus with 2.80% in terms of global mobile phone users.