Cell Phone Depreciation & Price Drops
2018 - 2019's Biggest Winners And Losers

Smartphone Depreciation Intro
Typically, cell phone depreciation is a result of the regular releases of new phones making yours outdated, the decline in software or hardware capabilities, second-hand market demand and physical general cosmetic wear. Taking your new cell phone out the box causes the same financial result as driving a brand new car out the showroom, its resale value tanks
That said, not every phone value depreciates the same, cell phone trade-in store BankMyCell tracked the trade-in prices hourly for 12 months so we can analyze when smartphone prices drop and find which phones are 2018’s biggest winners and losers.
Quick Links To The Data
Use the links below to jump to navigate the pricing analysis or jump straight to the bottom where we have over 100 phones depreciation values for 2018. Simply filter by brand, model, release date and depreciation rate to find this year’s biggest winners and losers.
Consumer Focused Report Summary
6 Need To Know Tips About Phone Depreciation
Galaxy S Price Drop Tips

Galaxy S Phones Might be the Worst Investment!
The Samsung Galaxy S9 released in March 2018 for $720. Almost 60% of its value vanished in nine months, being one of the fastest depreciating handsets ending the year, worth $290. Additionally, out of all the phones, in only nine months the S9 was ranked third for losing the most physical money out of all devices, followed by the S9 Plus in fourth.
In fact, the S9 lost 41.66% of its value in month one. If the S10 follows the same depreciation pattern as its predecessors, it is set to lose almost half its value in the first month of release.
Galaxy S9 Dropped Double the Rate of the iPhone X After Release
On a percentage basis, the Galaxy S9 depreciated almost twice as fast as the iPhone X from its original release price. As smartphones become more expensive, consumers need to be aware of these trends if they plan to use their old device as upgrade collateral.
- Galaxy S9 was released at $720, but was worth $290 9 months later (-59.72%)
- iPhone X was released at $999, but was worth $690 9 months later (-30.93%)
In fact, the S9 lost 10.73% more of its resale value in the first month of release than the iPhone X did in nine months! Ouch
iPhone Price Drop Tips

iPhone’s Have Solid Price Retention (Well, 9/12 Months ONLY)
A massive 68.86% of the iPhone X and 8’s total yearly depreciation was seen in Q4 following the Sept 2018 Apple Keynote (31.14% of their value between Q1-Q3). The months after the keynote is a trade-in black hole consumers should avoid, to visualize this data in physical money:
- Jan – Sept 2018: the iPhone X only depreciated $62 (9 months)
- Oct – Dec 2018: the iPhone X depreciated $138 (3 months following the event)

Secret: iPhone Values Trend Upwards Every January (Even New Ones!)
Brand new iPhones always get listed at a low price, this is due to trade-in stores looking to maximize profits when people keep their old phone and look to cash in the new one. The new iPhone XS/XR range AND the iPhone X/8 saw trade-in price increases as we entered 2019. This reaffirms that the 3 months following the keynote is a trade-in black hole that consumers should avoid.
General Price Drop Tips

Price Drop Hack: Abuse Trade-in Stores Price Locks (Earn $100+ More)
Customers that take advantage of trade-in stores 30-day price lock could have earned $100+ more selling an iPhone X before the event. Consumers should be aware that there is no obligation to send their device in, essentially they can lock the price and decide if they want the new phone after its announcement event.

Ignore Hype: Android Releases Don’t Cause Large Trade-In Price Crashes
The iPhones releases were the only that had a drastic impact on depreciation, typically most other Android devices see a small drop. For example, when tracking the 2015-2017 Galaxy S6-S8 models, most only saw drops of 5-13% in weeks following the March Galaxy S9 release.
iPhone Depreciation & Price Drops
2018 iPhone Resale Pricing Trends
Resale Value Impact Of 2018’s iPhone Releases
How much does an iPhone depreciate each year? The table below shows how the yearly release cycle is the driving factor in your iPhone’s trade in depreciation; this data demonstrates the devaluation of iPhone’s purchased in 2016-17. As you can see, if you’re planning on upgrading to a new model and you finally paid off your old phone, the headlines about selling your iPhone before the yearly release is not a statement to take lightly.
Between the US and UK markets we’ve tracked since 2009, we’ve consistently witnessed the most significant resale price drops every time a new iPhone is released – for newer models this can be well over $100 in a matter of weeks. Furthermore, as you’ll see from the chart below even the newer staggered release format between September-November did not spare the iPhones from falling in value. For up to date pricing, view your used iPhone trade-in prices here
- iPhone resale value aggressively plummets with every new iPhone release
- Out of the 38.46% loss in value the iPhone X 256GB received this year, 26.29% happened between Sept-Dec
- Out of the 29.91% loss in value the iPhone 8 Plus 256GB received this year, 20.75% happened between Sep-Dec
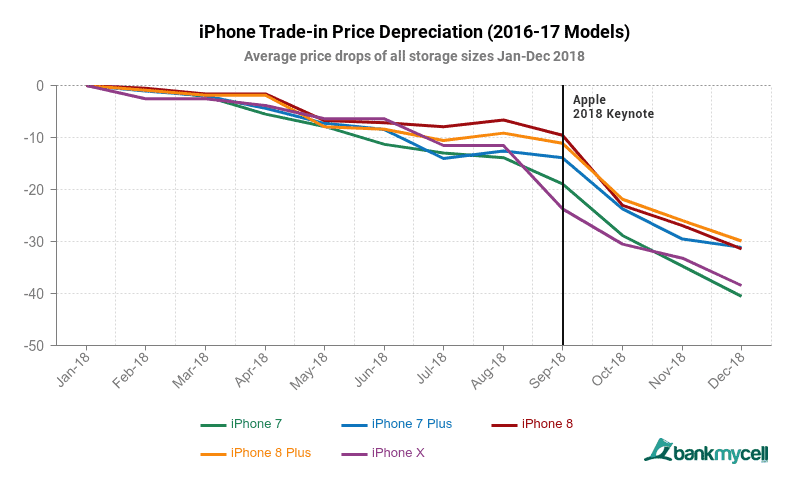
*Figures shown are averages from all storage sizes for each device, see here for storage capacity specific depreciation.
**Depreciation figures are from the first resale price listed in 2018, not the phones brand new price.
Brand New iPhone Depreciation (XS, XS Max And XR)
Following the standard September release pattern of Apple, new iPhones see a hard-hitting dip in value from their original resale value in the first few months, then stabilize as they enter the following year – this stabilization is seen in the previous chart above. In the case of this year’s iPhone releases, we ignored September pricing for the XS as they remained the same until October, then began to decline.
From the recent XS and XR releases in 2018, we’ve seen:
- iPhone XS Max lost 15.30% from its originally resale value
- iPhone XS lost 12.89% from its originally resale value
- iPhone XR lost 5.38% from its originally resale value (Nov 2018 Release)
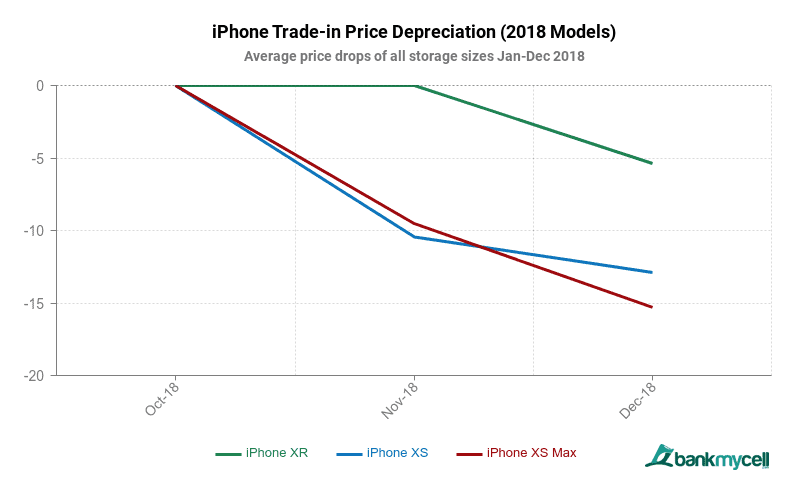
*Figures shown are averages from all storage sizes for each device, see here for storage capacity specific depreciation.
**Depreciation figures are from the first resale price listed in 2018, not the phones brand new price.
Resale Value Decline Of The 2017 iPhone’s
Again, the new iPhone keynote and releases triggered an overwhelming loss in value for last year’s iPhone 8, 8 Plus and X models. In fact, 78.89% of the iPhone 8’s total depreciation this year happened in just over 3 months following the announcement of the XS/XR models. Likewise, 69.37 of the iPhone 8 Plus and 69.99% of the iPhone X happened in the same period.
From its resale starting price in January 2018:
- iPhone 8 lost 31.41% with 24.78% dropping between Sept-Dec
- iPhone 8 Plus lost 29.91% with 20.75% dropping between Sept-Dec
- iPhone X lost 38.46% with 26.92% dropping between Sept-Dec
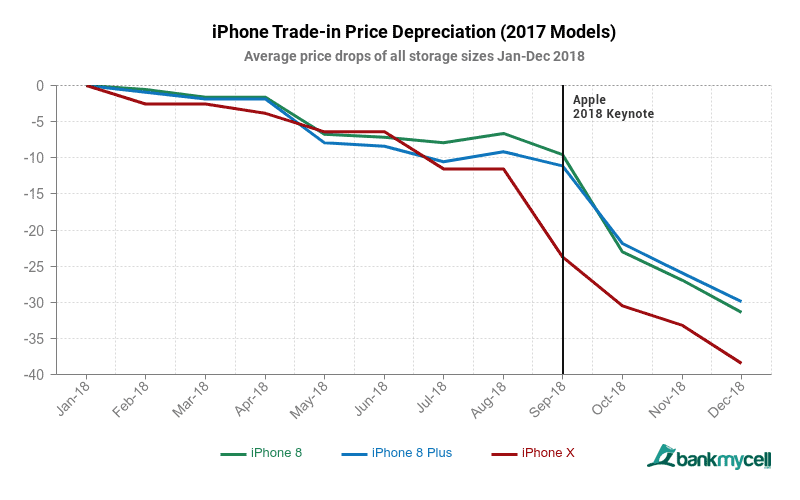
*Figures shown are averages from all storage sizes for each device, see here for storage capacity specific depreciation.
**Depreciation figures are from the first resale price listed in 2018, not the phones brand new price.
Resale Value Decline Of The 2016 iPhone’s
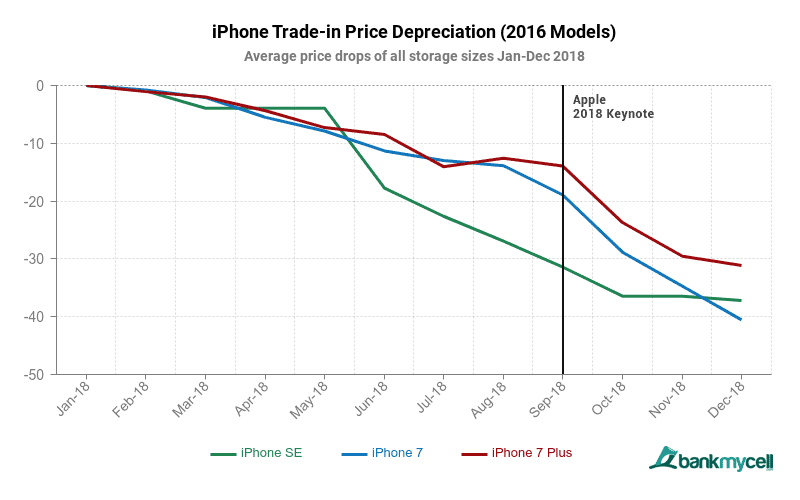
Breaking the normal release date pattern, the iPhone SE launched in March 2016, however, the iPhone 7/Plus came in September 2016 as usual. As you can see the decline of in value from year start to finish is much the same, however, the monthly decline curve is much steadier. A lower figure of 53.39% of the total year’s iPhone 7 depreciation happened over 3 months following the announcement of the XS/XR models, 59.58% for the iPhone 8 Plus – both are still much lower than 2017’s iPhone 8 losing 78.89%.
From its resale starting price in January 2018:
- iPhone SE only lost 10.28% of the 37.20% during the Sept-Dec
- iPhone 7 lost 40.55% with 21.65% dropping between Sept-Dec
- iPhone 7 Plus lost 31.13% with 18.55% dropping between Sept-Dec
*Figures shown are averages from all storage sizes for each device, see here for storage capacity specific depreciation.
**Depreciation figures are from the first resale price listed in 2018, not the phones brand new price.
Resale Value Decline Of The 2015 iPhone’s
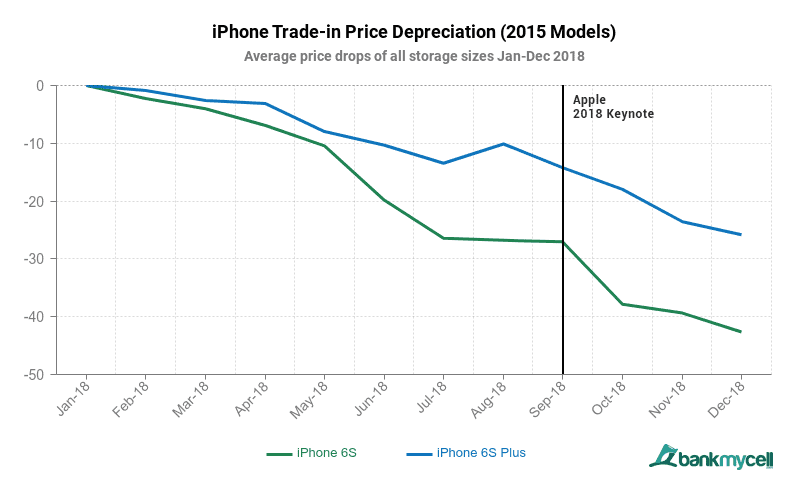
The iPhone 6S/Plus was released in September 2015, the data shows that even devices 3 years old can be impacted by the new releases in a big way. In this case, the more expensive 6S Plus model lost 60.82% of its total depreciation in 2018 from the XS announcement onwards – The iPhone 6S only lost 37.17% of its total.
From its resale starting price in January 2018:
- iPhone 6S lost 42.64% with a lower 15.85% decline between Sept-Dec
- iPhone 6S Plus lost 25.83% with 15.71% dropping between Sept-Dec
*Figures shown are averages from all storage sizes for each device, see here for storage capacity specific depreciation.
**Depreciation figures are from the first resale price listed in 2018, not the phones brand new price.
Samsung Galaxy S Depreciation & Price Drops
2018 Galaxy S Resale Pricing Trends
Samsung Galaxy S9 2018 Price Drop
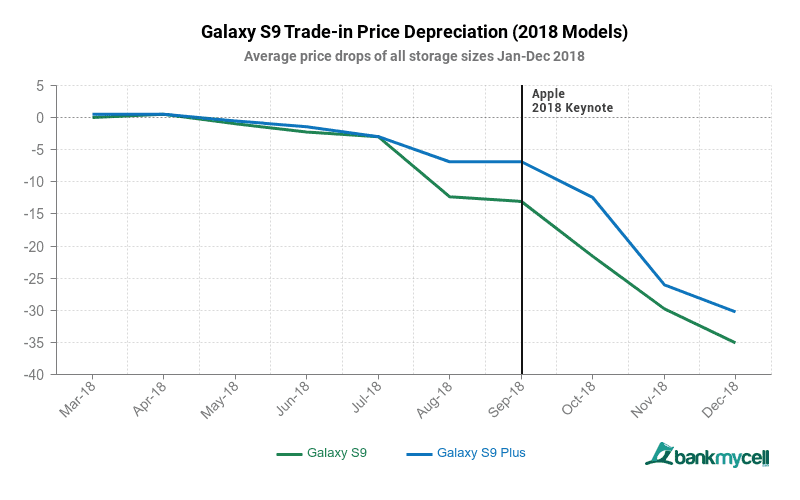
You would think the value of the latest phones packed full of cutting-edge power and features would be safe for a year or so, you’d be wrong. In less than nine months the Samsung Galaxy S9 and S9+ models have lost up to 35.07% of their resale value. Furthermore, when you look at the brand new price in March (S9: $720 / S9+: $840) these phones are now worth 59% less than what the consumer paid for them. That’s some crazy smartphone depreciation right there!
From its resale starting price in March 2018:
- Samsung Galaxy S9 lost 35.07% of its trade-in value, 59.72% of its brand new value
- Samsung Galaxy S9 Plus lost 30.26% of its trade-in value, 59.52% of its brand new value
*Figures shown are averages from all storage sizes for each device, see here for storage capacity specific depreciation.
**Depreciation figures are from the first resale price listed in 2018, not the phones brand new price.
Samsung Galaxy S7 And S8 2018 Price Drop
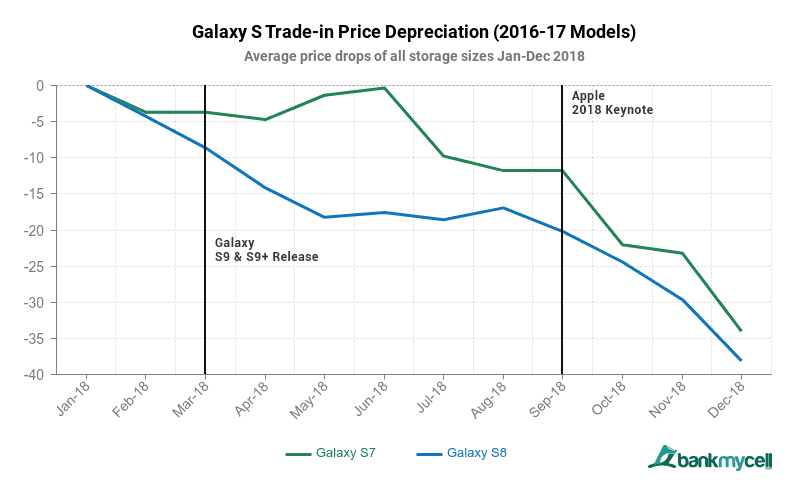
The release of the Samsung Galaxy S9 this year impacted the value of the Galaxy S8 the most, losing half of the total smartphone depreciation in the year in the first 4 months, similar to the iPhones. The Samsung Galaxy S7 pricing has been much more volatile, losing value initially during the months after the release then recovering to its initial year start value through in June.
From its resale starting price in January 2018:
- Samsung Galaxy S7 lost 34.01% of its trade-in value, a huge 33.67% being in Q3/Q4
- Samsung Galaxy S8 lost 38.11% of its trade-in value, 20.52% in the quarter following the S9 launch
*Figures shown are averages from all storage sizes for each device, see here for storage capacity specific depreciation.
**Depreciation figures are from the first resale price listed in 2018, not the phones brand new price.
Samsung Galaxy S6/S6 Edge 2018 Price Drop
The values of the Galaxy S6 and S6 Edge showed real volatility following the S9 announcement, instantly dropping the resale value by half of its total depreciation in the year. This sharp spike trend was however short-lived, much like the S7 in the previous chart, all 3 devices showed signs of recovering their worth 2-3 months following the S9 launch.
From its resale starting price in January 2018:
- Samsung Galaxy S6 lost 15.34% of its trade-in value
- Samsung Galaxy S6 Edge lost 9.12% of its trade-in value
- Samsung Galaxy S6 Edge+ lost 14.34% of its trade-in value
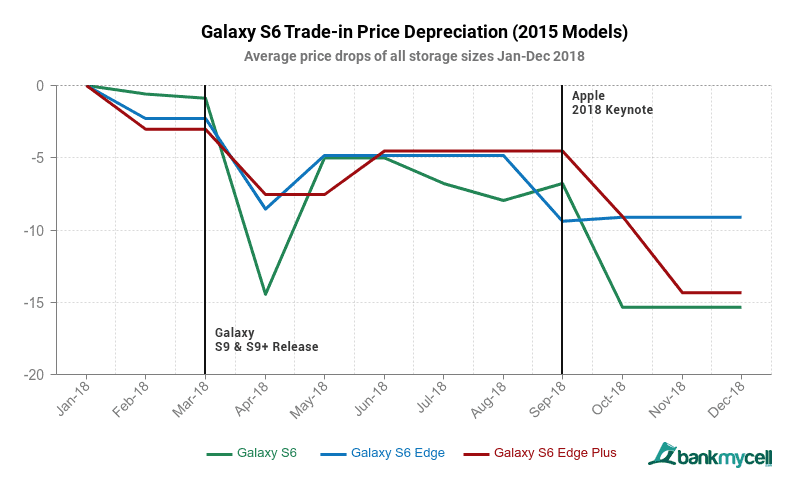
*Figures shown are averages from all storage sizes for each device, see here for storage capacity specific depreciation.
**Depreciation figures are from the first resale price listed in 2018, not the phones brand new price.
Top 10 Phones Depreciating In 2018
Significant Drops By Value And Percentage
Top 10 Phones Losing Value By Percentage
The table below shows the cell phones that lost the largest amount of value by percentage between January and December 2018. The majority of the devices are several years old so it’s no wonder the demand is wavering as they become vastly outdated. The LG G6, however, was released the year before (March 2017) and lost just under half worth, starting at $220 it declined to $110 in 2018.
| BRAND | MODEL | DEPRECIATION | RELEASE DATE |
|---|---|---|---|
| Sony | Xperia Z3+ | -57.78% | Jan-15 |
| Apple | iPhone 5S | -51.67% | Sep-13 |
| Apple | iPhone 6 Plus | -51.00% | Sep-14 |
| Huawei | Nexus 6P | -49.86% | Sep-15 |
| LG | G6 | -49.55% | Mar-17 |
| Samsung | Galaxy S4 | -48.28% | Mar-13 |
| Apple | iPhone 6 | -47.22% | Sep-14 |
| Apple | iPhone 5 | -46.78% | Sep-12 |
| Apple | iPhone 6S | -45.51% | Sep-15 |
| Apple | iPhone 5C | -43.25% | Sep-13 |
Top 10 Phones Decreasing By Physical Value
Samsung Galaxy S9 and S9+ were the only handsets released in 2018 that saw their value plummet, as smartphones get increasingly more expensive, it begs the question; Are the latest Samsung Galaxy S devices worth investing in if you upgrade every year?
The wrath of the new iPhone XS / XS Max / XR releases had enough impact to leave the iPhone X depreciating by $190. As mentioned in the iPhone specific depreciation part of this study, 26.29% of the total 38.46% yearly depreciation of the iPhone X 256GB was seen in Oct-Dec 2018 following the iPhone event. It’s also worth noting that now the trade-in market isn’t as saturated by iPhone X models, the value at the end of February 2019 has actually increased by $50, signifying just how important it is to not sell during Q4 following the announcements.
| BRAND | MODEL | VALUE LOSS | RELEASE DATE |
|---|---|---|---|
| Apple | iPhone X | $190 | Nov-17 |
| Apple | iPhone 8 Plus | $160 | Sep-17 |
| Samsung | Galaxy S9 | $156 | Feb-18 |
| Samsung | Galaxy S9+ Plus | $147 | Feb-18 |
| Apple | iPhone 8 | $144 | Sep-17 |
| Apple | iPhone 7 | $137 | Sep-16 |
| Apple | iPhone 7 Plus | $126 | Sep-16 |
| Samsung | Galaxy S8 | $117 | Apr-17 |
| Pixel 2 | $110 | Oct-17 | |
| Apple | iPhone 6S | $110 | Sep-15 |
100+ Popular Phones Depreciation In 2018
Phone Depreciation Winners And Losers
| Brand | Model | Start Price | End Price | Depreciation | Release Date |
|---|---|---|---|---|---|
| Apple | iPhone 5S 16GB | 65 | 26 | -60.00% | Sep-13 |
| Sony | Xperia Z3+ | 90 | 38 | -57.78% | Jan-15 |
| Huawei | Nexus 6P 32GB | 120 | 53 | -55.83% | Sep-15 |
| Apple | iPhone 5 16GB | 46 | 22 | -52.17% | Sep-12 |
| Apple | iPhone 5S 32GB | 70 | 34 | -51.43% | Sep-13 |
| Apple | iPhone 6 Plus 32GB | 200 | 98 | -51.00% | Sep-14 |
| Apple | iPhone 6 32GB | 140 | 70 | -50.00% | Sep-14 |
| LG | G6 64GB | 220 | 111 | -49.55% | Mar-17 |
| Huawei | Nexus 6P 128GB | 142 | 72 | -49.30% | Sep-15 |
| Samsung | Galaxy S4 32GB | 58 | 30 | -48.28% | Mar-13 |
| Apple | iPhone 6S 128GB | 235 | 125 | -46.81% | Sep-15 |
| Apple | iPhone 6 16GB | 135 | 75 | -44.44% | Sep-14 |
| Huawei | Nexus 6P 64GB | 126 | 70 | -44.44% | Sep-15 |
| Apple | iPhone 6S 32GB | 190 | 106 | -44.21% | Sep-15 |
| Apple | iPhone 5C 16GB | 50 | 28 | -44.00% | Sep-13 |
| Apple | iPhone 5S 64GB | 78 | 44 | -43.59% | Sep-13 |
| Apple | iPhone 5C 8GB | 40 | 23 | -42.50% | Sep-13 |
| Apple | iPhone SE 32GB | 130 | 75 | -42.31% | Mar-16 |
| Apple | iPhone 7 32GB | 310 | 180 | -41.94% | Sep-16 |
| Apple | iPhone 5 64GB | 58 | 34 | -41.38% | Sep-12 |
| Apple | iPhone 7 256GB | 366 | 215 | -41.26% | Sep-16 |
| Apple | iPhone 6 128GB | 170 | 100 | -41.18% | Sep-14 |
| Apple | iPhone 6S 16GB | 170 | 101 | -40.59% | Sep-15 |
| HTC | One M8 16GB | 42 | 25 | -40.48% | Mar-14 |
| HTC | One M8 32GB | 42 | 25 | -40.48% | Mar-14 |
| Apple | iPhone 5C 32GB | 55 | 33 | -40.00% | Sep-13 |
| HTC | 10 32GB | 116 | 70 | -39.66% | Apr-16 |
| Samsung | Galaxy S8 128GB | 314 | 190 | -39.49% | Apr-17 |
| LG | Nexus 5X 16GB | 82 | 50 | -39.02% | Sep-15 |
| Motorola | Nexus 6 64GB | 90 | 55 | -38.89% | Nov-14 |
| LG | Nexus 5X 32GB | 85 | 52 | -38.82% | Sep-15 |
| Apple | iPhone 7 128GB | 340 | 209 | -38.53% | Sep-16 |
| Samsung | Galaxy S4 64GB | 52 | 32 | -38.46% | Mar-13 |
| Apple | iPhone X 256GB | 780 | 480 | -38.46% | Nov-17 |
| Motorola | Nexus 6 32GB | 86 | 53 | -38.37% | Nov-14 |
| Samsung | Galaxy S9 256GB | 470 | 290 | -38.30% | Feb-18 |
| Apple | iPhone 5 32GB | 50 | 31 | -38.00% | Sep-12 |
| Apple | iPhone 6S 64GB | 200 | 124 | -38.00% | Sep-15 |
| Apple | iPhone 6 64GB | 144 | 90 | -37.50% | Sep-14 |
| HTC | 10 64GB | 120 | 75 | -37.50% | Apr-16 |
| Samsung | Galaxy J3 (2017) | 40 | 25 | -37.50% | Jun-17 |
| Samsung | Galaxy S8 64GB | 300 | 190 | -36.67% | Apr-17 |
| Pixel 2 64GB | 300 | 190 | -36.67% | Oct-17 | |
| LG | G3 | 41 | 26 | -36.59% | May-14 |
| Apple | iPhone SE 16GB | 110 | 70 | -36.36% | Mar-16 |
| Apple | iPhone SE 64GB | 140 | 90 | -35.71% | Mar-16 |
| Samsung | Galaxy S9 128GB | 450 | 290 | -35.56% | Feb-18 |
| LG | G5 | 82 | 53 | -35.37% | Jan-16 |
| Apple | iPhone SE 128GB | 155 | 101 | -34.84% | Mar-16 |
| Apple | iPhone X 64GB | 720 | 470 | -34.72% | Nov-17 |
| Samsung | Galaxy S7 64GB | 150 | 98 | -34.67% | Mar-16 |
| LG | G4 | 58 | 38 | -34.48% | Jan-16 |
| Apple | iPhone 6 Plus 128GB | 206 | 135 | -34.47% | Sep-14 |
| HTC | One M9 | 64 | 42 | -34.38% | Jan-15 |
| Pixel 2 128GB | 320 | 210 | -34.38% | Oct-17 | |
| Apple | iPhone 7 Plus 256GB | 430 | 285 | -33.72% | Sep-16 |
| Nokia | Lumia 1020 | 30 | 20 | -33.33% | Jul-13 |
| Sony | Xperia Z3 Compact | 60 | 40 | -33.33% | Jan-14 |
| HTC | One M8s | 30 | 20 | -33.33% | Mar-14 |
| Samsung | Galaxy S7 32GB | 147 | 98 | -33.33% | Mar-16 |
| Samsung | Galaxy J7 (2017) | 75 | 50 | -33.33% | Jan-17 |
| Sony | Xperia Z2 | 70 | 47.5 | -32.14% | Jan-14 |
| Samsung | Galaxy S9+ Plus 128GB | 500 | 340 | -32.00% | Feb-18 |
| Apple | iPhone 6 Plus 16GB | 170 | 116 | -31.76% | Sep-14 |
| Apple | iPhone 8 256GB | 490 | 335 | -31.63% | Sep-17 |
| Apple | iPhone 8 Plus 256GB | 570 | 390 | -31.58% | Sep-17 |
| Apple | iPhone 7 Plus 32GB | 350 | 240 | -31.43% | Sep-16 |
| Apple | iPhone 8 64GB | 430 | 296 | -31.16% | Sep-17 |
| Samsung | Galaxy S9 64GB | 420 | 290 | -30.95% | Feb-18 |
| Apple | iPhone 7 Plus 128GB | 405 | 280 | -30.86% | Sep-16 |
| LG | G6 32GB | 160 | 111 | -30.63% | Mar-17 |
| Apple | iPhone 6 Plus 64GB | 188 | 131 | -30.32% | Sep-14 |
| Apple | iPhone 6S Plus 128GB | 270 | 190 | -29.63% | Sep-15 |
| Pixel 2 XL 128GB | 350 | 247 | -29.43% | Oct-17 | |
| HTC | Desire 820 | 35 | 25 | -28.57% | Sep-14 |
| Samsung | Galaxy S9+ Plus 64GB | 475 | 340 | -28.42% | Feb-18 |
| HTC | Desire Eye | 50 | 36 | -28.00% | Jan-15 |
| Apple | iPhone 8 Plus 64GB | 500 | 360 | -28.00% | Sep-17 |
| Samsung | Galaxy Note 3 16GB | 61 | 44 | -27.87% | Sep-13 |
| Pixel 2 XL 64GB | 320 | 232 | -27.50% | Oct-17 | |
| HTC | One A9 | 70 | 51 | -27.14% | Jun-18 |
| Apple | iPhone 6S Plus 64GB | 240 | 178 | -25.83% | Sep-15 |
| Apple | iPhone 6S Plus 16GB | 215 | 160 | -25.58% | Sep-15 |
| LG | K10 | 20 | 15 | -25.00% | Jan-16 |
| Samsung | Galaxy Note 3 32GB | 61 | 46 | -24.59% | Sep-13 |
| Samsung | Galaxy S5 32GB | 58 | 44 | -24.14% | May-14 |
| Sony | Xperia Z2 Tablet 32GB | 52 | 40 | -23.08% | Mar-14 |
| Samsung | Galaxy Note 5 32GB | 131 | 101 | -22.90% | Aug-15 |
| Samsung | Galaxy Note 3 64GB | 61 | 48 | -21.31% | Sep-13 |
| Apple | iPhone 6S Plus 32GB | 204 | 161 | -21.08% | Sep-15 |
| Samsung | Galaxy Note 5 128GB | 130 | 104 | -20.00% | Aug-15 |
| Samsung | Galaxy Note 5 64GB | 131 | 106 | -19.08% | Aug-15 |
| Samsung | Galaxy S5 16GB | 54 | 44 | -18.52% | May-14 |
| Samsung | Galaxy S6 64GB | 118 | 97 | -17.80% | Mar-15 |
| Apple | iPhone XS Max 512GB | 825 | 680 | -17.58% | Sep-18 |
| Sony | Xperia Z2 Tablet 16GB | 40 | 33 | -17.50% | Mar-14 |
| Samsung | Galaxy S6 Edge+ 64GB | 140 | 116 | -17.14% | Aug-15 |
| Sony | Xperia Z3 | 60 | 50.5 | -15.83% | Jan-14 |
| Apple | iPhone XS 512GB | 760 | 640 | -15.79% | Sep-18 |
| Apple | iPhone XS Max 64GB | 680 | 580 | -14.71% | Sep-18 |
| Samsung | Galaxy S6 Edge 128GB | 130 | 111 | -14.62% | Mar-15 |
| Samsung | Galaxy S6 128GB | 121 | 104 | -14.05% | Mar-15 |
| Samsung | Galaxy S6 32GB | 100 | 86 | -14.00% | Mar-15 |
| Samsung | Galaxy Note Edge 32GB | 105 | 91 | -13.33% | Nov-14 |
| Samsung | Galaxy Note Edge 64GB | 105 | 91 | -13.33% | Nov-14 |
| Apple | iPhone XS Max 256GB | 750 | 650 | -13.33% | Sep-18 |
| Apple | iPhone XS 64GB | 600 | 521 | -13.17% | Sep-18 |
| Samsung | Galaxy S4 16GB | 32 | 28 | -12.50% | Mar-13 |
| Apple | iPhone XR 256GB | 500 | 440 | -12.00% | Oct-18 |
| Samsung | Galaxy S6 Edge+ 32GB | 125 | 111 | -11.20% | Aug-15 |
| Samsung | Galaxy S6 Edge 64GB | 120 | 107 | -10.83% | Mar-15 |
| Apple | iPhone XS 256GB | 650 | 590 | -9.23% | Sep-18 |
| LG | V30 | 222 | 211 | -4.95% | Sep-17 |
| Apple | iPhone XR 64GB | 400 | 390 | -2.50% | Oct-18 |
| Apple | iPhone XR 128GB | 470 | 470 | 0.00% | Oct-18 |
Depreciation Data Explained
2018-2019 Specific Data Methodology
- The depreciation data displayed is for the online trade-in market in 2018-2019
- The initial figure is the first available trade-in price for a phone in 2018, the final figure is the latest available price for a phone in 12/31/2018
- Depreciation is measured by a percentage decrease calculation of those figures.
- This is not a depreciation decrease from the devices initial launch (unless the phone launched in 2018 or being specifically mentioned within the content)
Today’s Phone Trade-In Prices
To get an idea of the values you can get when selling your old phone in the US, check out our main website: