Smartphone Market Share in India (2025)


Did you know that Xiaomi has been leading India’s smartphone manufacturing market in 2024? The brand is followed by Vivo and Samsung.
Xiaomi currently has a 20.70% annual market share, while Vivo has 18.23%, and Samsung has 13.69%.
In this article, you will learn more about the overall smartphone shipments in India. From the mid-range segment to premium segment smartphone shipments in the country, discover how many million units are being sold yearly, monthly, and quarterly.
Most Popular Phone Brands in India (Most Recent Quarter)
| Brands | Market Share |
|---|---|
| Xiaomi | 20.67% |
| Vivo | 18.22% |
| Samsung | 13.69% |
| Realme | 13.45% |
| OPPO | 11.71% |
| OnePlus | 4.82% |
| Apple | 4.10% |
| Others | 13.30% |
Editor’s Picks: India Smartphone Market
- Xiaomi by market share percentage: Xiaomi has a quarterly market share of 20.67% in Q1 2024, a 0.19% decline compared to Q4 2023. Xiaomi holds the highest market share in the Indian smartphone vendor market.
- Vivo by market share percentage: Vivo’s quarterly market share for 2024 is second in India at 18.22%, a 0.25% increase compared to the fourth quarter of 2023. Vivo has seen an upward trend in its most recent quarters.
- Samsung by market share percentage: Samsung’s 2024 market share in India is 13.69%, a decrease of 0.11% compared to Q4 2023. Samsung holds the third-largest market share in the country.
- Huawei by market share percentage: Huawei’s 2024 market share in India is at 0.41%. Compared to Q4 2023, Huawei’s market share decreased by 0.04%. The brand is ranked 11th in the market.
- OPPO by market share percentage: Oppo ranks fifth in brand share in India, with a quarterly market share of 11.71%. This is a 0.15% decline compared to the fourth quarter of 2023.
- Apple by market share percentage: Apple currently ranks seventh in India in terms of brand share, with a market share of 4.10%, a 0.16% increase in market share for the brand compared to the fourth quarter of 2023.
- General market share percentage: Xiaomi has the highest market share in India in the most recent quarter, with 20.67%. Vivo recently overtook Samsung and comes second with an 18.22% brand share. Samsung is now ranked third with a 13.69% brand share. Realme, OPPO, OnePlus, and Apple complete the top seven smartphone brands in India, with a market share of 13.45%, 11.71%, 4.82%, and 4.10%, respectively.
In this Article:
- India Smartphone Market Share (Monthly & Quarterly)
- India Smartphone Market Share (Yearly)
- 1. Xiaomi – India Smartphone Market Data
- 2. Samsung – India Smartphone Market Data
- 3. Vivo – India Smartphone Market Data
- 4. Huawei – India Smartphone Market Data
- 5. Oppo – India Smartphone Market Data
- 6. Apple – India Smartphone Market Data
Market Share of Phones in India
Indian Smartphone Market Share (This Month)
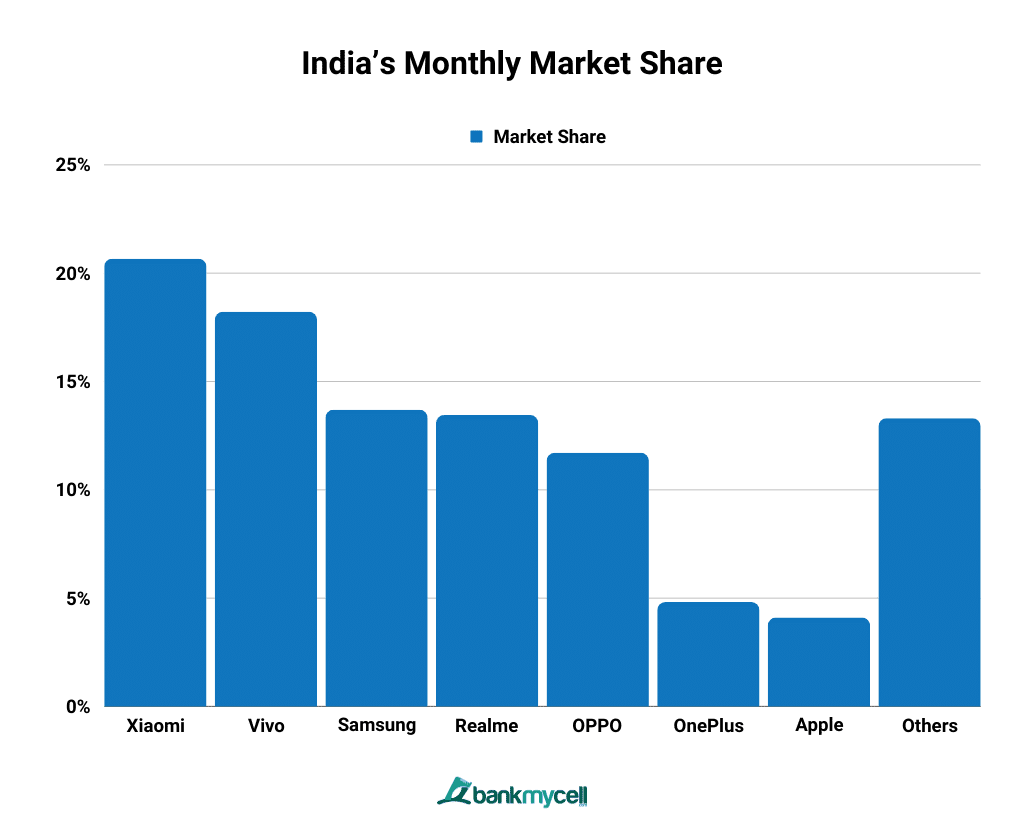
India’s Monthly Market Share
| Brands | Market Share |
|---|---|
| Xiaomi | 20.67% |
| Vivo | 18.22% |
| Samsung | 13.69% |
| Realme | 13.45% |
| OPPO | 11.71% |
| OnePlus | 4.82% |
| Apple | 4.10% |
| Others | 13.30% |
- Data Table
-
India’s Monthly Market Share
Brands Market Share Xiaomi 20.67% Vivo 18.22% Samsung 13.69% Realme 13.45% OPPO 11.71% OnePlus 4.82% Apple 4.10% Others 13.30% - Data Graph
-

Xiaomi leads the monthly market share of smartphone shipments in India with 20.67%. It is followed by Vivo with 18.22% and Samsung with 13.69%. Realme, OPPO, OnePlus, and Apple follow the top three, with 13.45%, 11.71%, 4.82%, and 4.10% market penetration rates, respectively.
There is a significant difference in consumer demand between India’s top five smartphone vendors from the rest. The top 5 vendors dominate and take more than 70% of the market share, while the other vendors take less than 5% market share each in the same period.
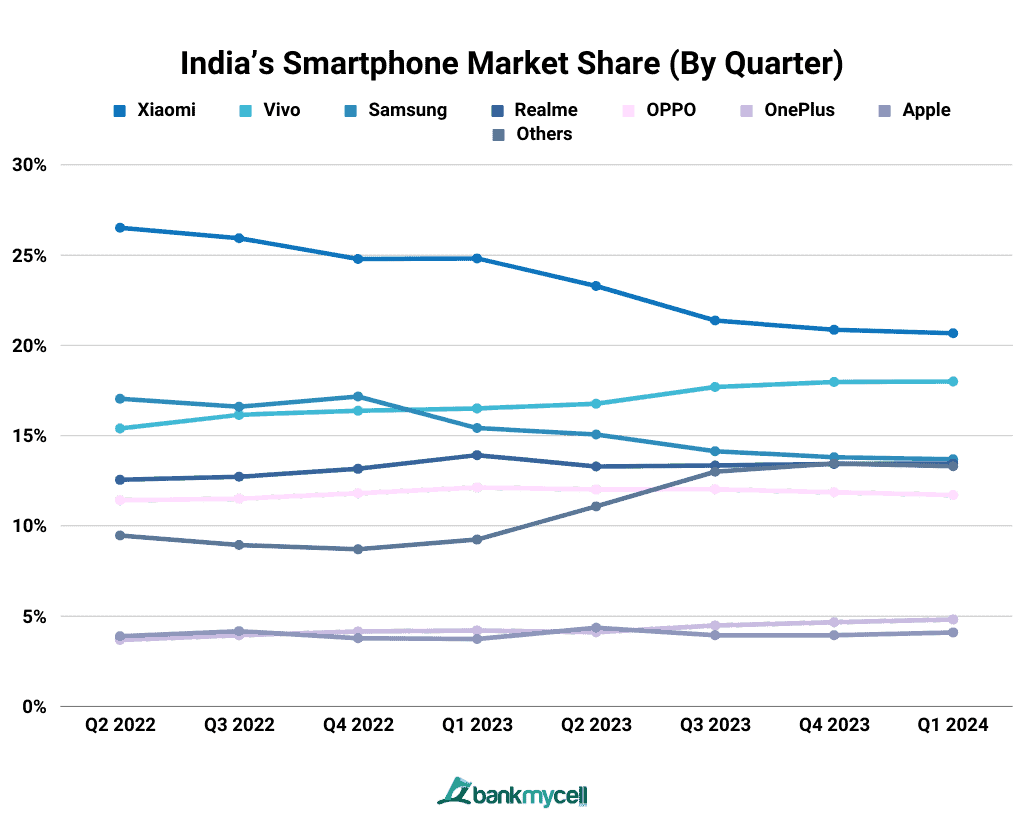
India’s Smartphone Market Share (By Quarter)
| Brands | Q2 2022 | Q3 2022 | Q4 2022 | Q1 2023 | Q2 2023 | Q3 2023 | Q4 2023 | Q1 2024 |
|---|---|---|---|---|---|---|---|---|
| Xiaomi | 26.52% | 25.94% | 24.79% | 24.82% | 23.29% | 21.38% | 20.86% | 20.67% |
| Vivo | 15.40% | 16.15% | 16.38% | 16.51% | 16.77% | 17.69% | 17.97% | 18..22% |
| Samsung | 17.04% | 16.60% | 17.17% | 15.42% | 15.06% | 14.14% | 13.80% | 13.69% |
| Realme | 12.55% | 12.72% | 13.16% | 13.92% | 13.29% | 13.35% | 13.43% | 13.45% |
| OPPO | 11.42% | 11.50% | 11.81% | 12.13% | 12.01% | 12.03% | 11.86% | 11.71% |
| OnePlus | 3.68% | 3.94% | 4.15% | 4.21% | 4.11% | 4.48% | 4.66% | 4.82% |
| Apple | 3.89% | 4.17% | 3.78% | 3.73% | 4.36% | 3.94% | 3.94% | 4.1% |
| Others | 9.47% | 8.94% | 8.70% | 9.24% | 11.08% | 13.00% | 13.46% | 13.3% |
- Data Table
-
Brands Q2 2022 Q3 2022 Q4 2022 Q1 2023 Q2 2023 Q3 2023 Q4 2023 Q1 2024 Xiaomi 26.52% 25.94% 24.79% 24.82% 23.29% 21.38% 20.86% 20.67% Vivo 15.40% 16.15% 16.38% 16.51% 16.77% 17.69% 17.97% 18..22% Samsung 17.04% 16.60% 17.17% 15.42% 15.06% 14.14% 13.80% 13.69% Realme 12.55% 12.72% 13.16% 13.92% 13.29% 13.35% 13.43% 13.45% OPPO 11.42% 11.50% 11.81% 12.13% 12.01% 12.03% 11.86% 11.71% OnePlus 3.68% 3.94% 4.15% 4.21% 4.11% 4.48% 4.66% 4.82% Apple 3.89% 4.17% 3.78% 3.73% 4.36% 3.94% 3.94% 4.1% Others 9.47% 8.94% 8.70% 9.24% 11.08% 13.00% 13.46% 13.3% - Data Graph
-

India’s smartphone shipments increased at varying rates by brand, with Xiaomi having the highest market share in Q1 of 2024, with 20.67%. However, that rate is a 0.19% decline from the fourth quarter of 2023. In contrast, Vivo’s quarterly market share increased, rising from 17.97% in the fourth quarter of 2023 to 18.22% in Q1 2024.
Samsung, Realme, OPPO, and OnePlus follow these top smartphone brands in India, with a market share of 13.69%, 13.45%, 11.71%, and 4.82%, respectively. Apple trailed with 4.10% in the most recent quarter, a 0.16% increase from Q4 2023.
Key Stats:
- India’s overall shipments reached over 37 million units of smartphones in the second quarter of 2022. It’s a decline of 5% compared to the first quarter of 2021.
- The average selling price of smartphones in India consistently grew quarter-on-quarter since the fourth quarter of 2020. Figures show a 15% year-on-year growth or around USD $213 average selling price in the second quarter of 2022.
- According to Canalys analyst Sanyam Chaurasia, the festival season increased consumer demand in the final few weeks of Q3 2022. In 2022, entry-level device contribution also dropped due to inflation, while the mid-to-high segment performed relatively well due to aggressive promotions.
- Menka Kumari, an analyst from the Industry Intelligence Group of CyberMedia Research, says the ultra-premium segment of 5G smartphones had a 170% year-on-year growth, or more than 1 million Indian rupees, during the third quarter of 2022.
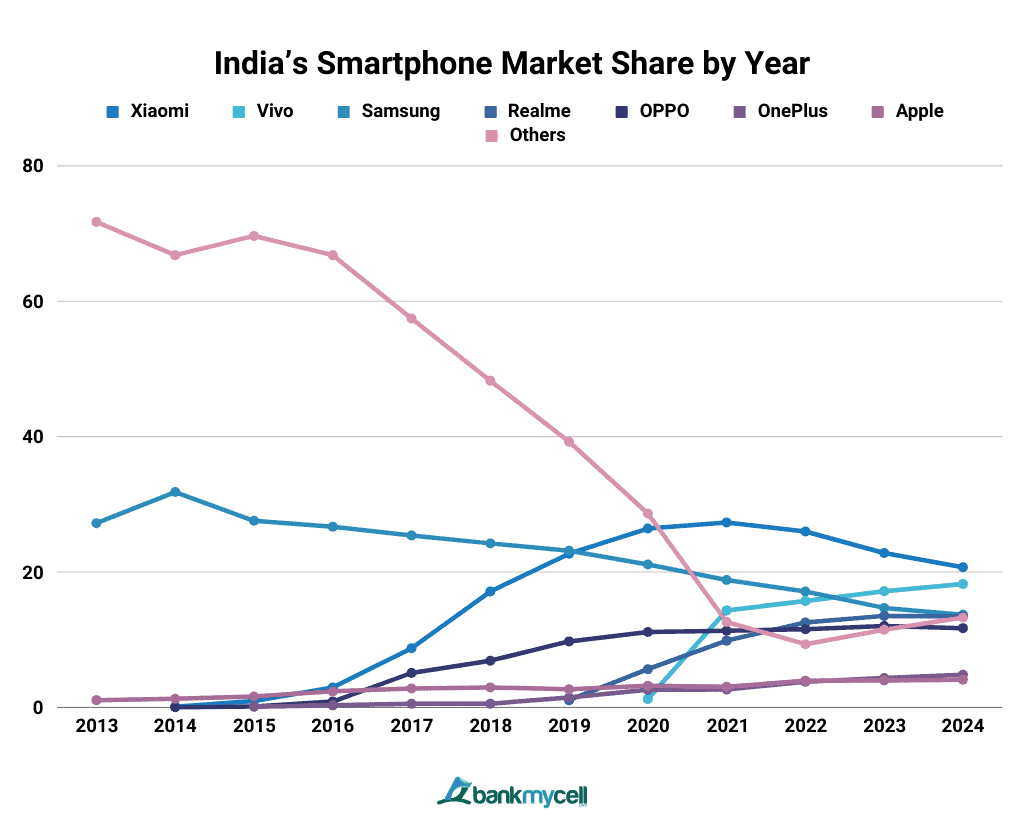
India’s Smartphone Market Share by Year (2013-2024)
| Brands | 2013 | 2014 | 2015 | 2016 | 2017 | 2018 | 2019 | 2020 | 2021 | 2022 | 2023 | 2024 |
|---|---|---|---|---|---|---|---|---|---|---|---|---|
| Xiaomi | 0 | 0.11 | 0.95 | 2.95 | 8.74 | 17.11 | 22.71 | 26.42 | 27.31 | 25.98 | 22.81 | 20.7 |
| Vivo | 0 | 0 | 0 | 0 | 0 | 0 | 0 | 1.24 | 14.33 | 15.73 | 17.15 | 18.23 |
| Samsung | 27.21 | 31.81 | 27.57 | 26.7 | 25.41 | 24.23 | 23.14 | 21.11 | 18.82 | 17.11 | 14.7 | 13.69 |
| Realme | 0 | 0 | 0 | 0 | 0 | 0 | 1.06 | 5.64 | 9.86 | 12.55 | 13.52 | 13.46 |
| OPPO | 0 | 0.02 | 0.13 | 0.86 | 5.08 | 6.9 | 9.75 | 11.15 | 11.33 | 11.56 | 12.02 | 11.71 |
| OnePlus | 0 | 0 | 0.1 | 0.3 | 0.53 | 0.55 | 1.45 | 2.61 | 2.64 | 3.79 | 4.34 | 4.82 |
| Apple | 1.07 | 1.27 | 1.61 | 2.37 | 2.8 | 2.95 | 2.67 | 3.21 | 3.05 | 3.92 | 3.98 | 4.08 |
| Others | 71.71 | 66.81 | 69.65 | 66.81 | 57.45 | 48.26 | 39.25 | 28.64 | 12.62 | 9.34 | 11.48 | 13.28 |
- Data Table
-
Brands 2013 2014 2015 2016 2017 2018 2019 2020 2021 2022 2023 2024 Xiaomi 0 0.11 0.95 2.95 8.74 17.11 22.71 26.42 27.31 25.98 22.81 20.7 Vivo 0 0 0 0 0 0 0 1.24 14.33 15.73 17.15 18.23 Samsung 27.21 31.81 27.57 26.7 25.41 24.23 23.14 21.11 18.82 17.11 14.7 13.69 Realme 0 0 0 0 0 0 1.06 5.64 9.86 12.55 13.52 13.46 OPPO 0 0.02 0.13 0.86 5.08 6.9 9.75 11.15 11.33 11.56 12.02 11.71 OnePlus 0 0 0.1 0.3 0.53 0.55 1.45 2.61 2.64 3.79 4.34 4.82 Apple 1.07 1.27 1.61 2.37 2.8 2.95 2.67 3.21 3.05 3.92 3.98 4.08 Others 71.71 66.81 69.65 66.81 57.45 48.26 39.25 28.64 12.62 9.34 11.48 13.28 - Data Graph
-

Xiaomi leads India’s overall 2024 market share for smartphone manufacturers with a 20.70% market share. Xiaomi’s market share remain robust since taking the top spot in the overall smartphone market in India in 2020. Vivo follows with a yearly market share of 18.23%. Vivo has only recently risen to the second position after beating Samsung in 2023. While Samsung currently takes the third spot at 13.69%, it had previously been the top smartphone brand in the country from 2014-2019 and then slid to the second position from 2020-2022.
XIAOMI
Market Share of Xiaomi in India
Xiaomi’s market share in India is 20.67% as of this month, making it the country’s leading smartphone manufacturer. However, this is a 4.31% decline from Xiaomi’s peak monthly market share in 2023 at 24.98%.
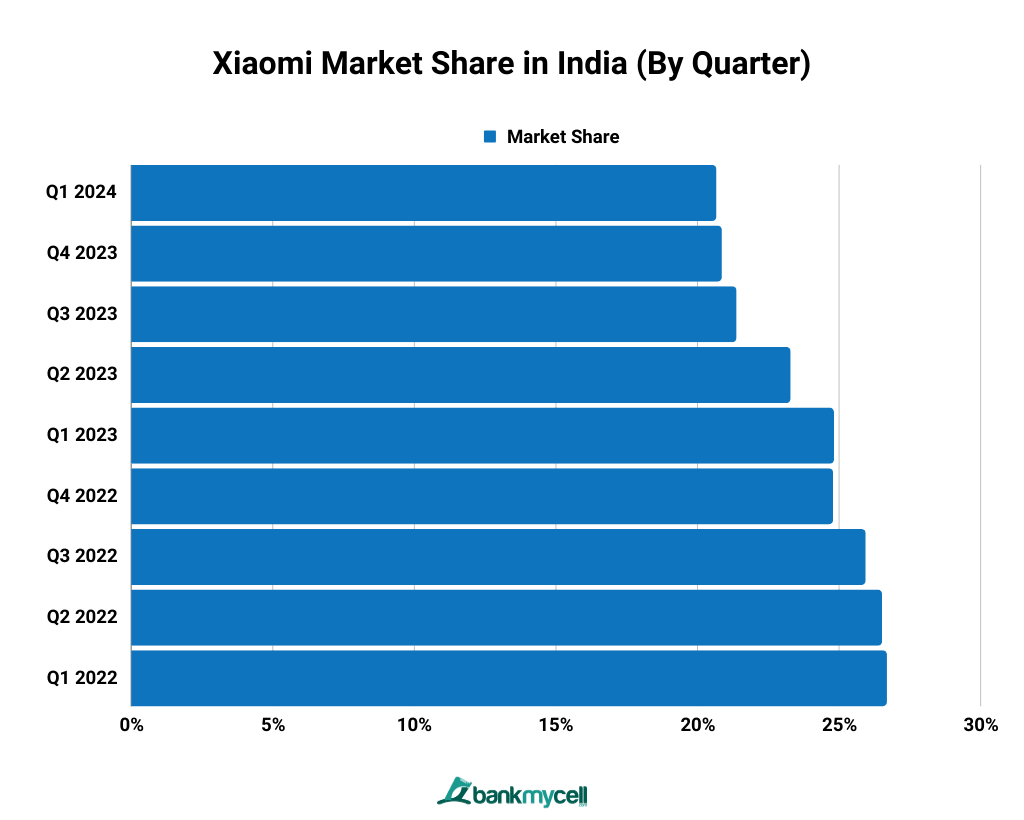
Xiaomi Market Share in India (By Quarter)
| Quarter | Market Share |
|---|---|
| Q1 2024 | 20.67% |
| Q4 2023 | 20.86% |
| Q3 2023 | 21.38% |
| Q2 2023 | 23.29% |
| Q1 2023 | 24.82% |
| Q4 2022 | 24.79% |
| Q3 2022 | 25.94% |
| Q2 2022 | 26.52% |
| Q1 2022 | 26.69% |
- Data Table
-
Quarter Market Share Q1 2024 20.67% Q4 2023 20.86% Q3 2023 21.38% Q2 2023 23.29% Q1 2023 24.82% Q4 2022 24.79% Q3 2022 25.94% Q2 2022 26.52% Q1 2022 26.69% - Data Graph
-

The market share of Xiaomi in Q1 2024 is 20.67%, a 0.19% decrease from Q4 2023. However, it continues to be the market leader in overall quarterly brand share. Xiaomi achieved its highest quarterly share in 2022 with a 26.69% market share.
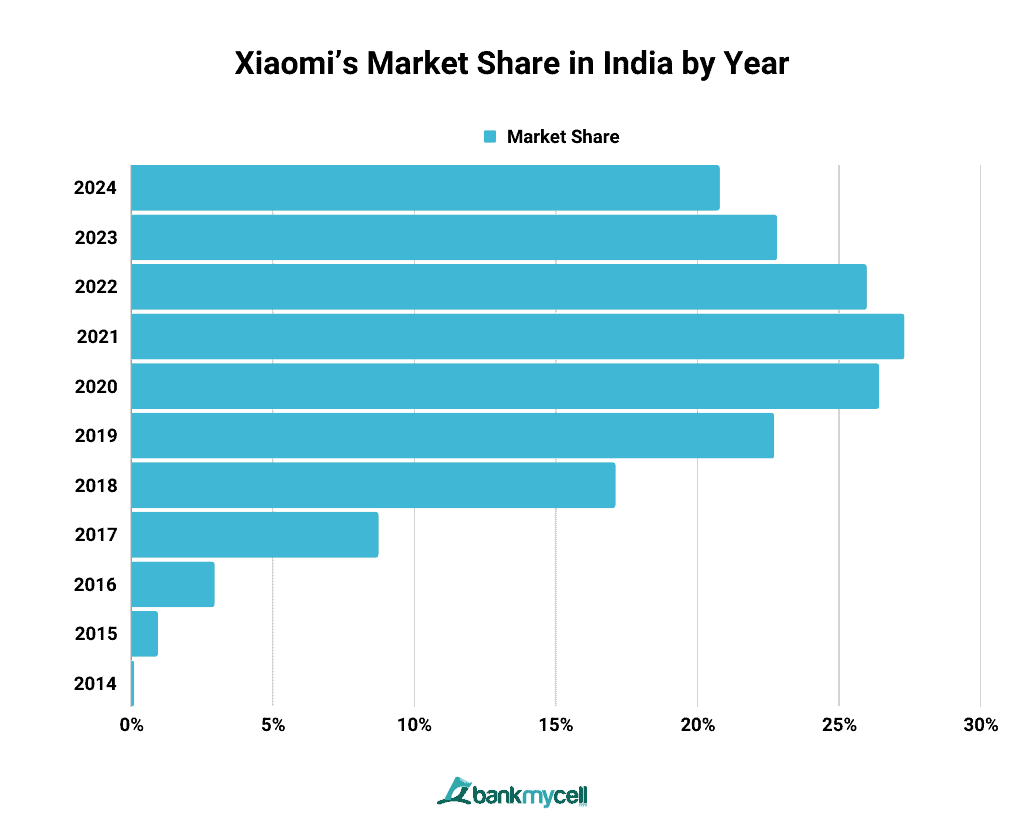
Xiaomi’s Market Share in India by Year (2014-2024)
| Year | Market Share |
|---|---|
| 2024 | 20.70% |
| 2023 | 22.81% |
| 2022 | 25.98% |
| 2021 | 27.31% |
| 2020 | 26.42% |
| 2019 | 22.71% |
| 2018 | 17.11% |
| 2017 | 8.74% |
| 2016 | 2.95% |
| 2015 | 0.95% |
- Data Table
-
Year Market Share 2024 20.70% 2023 22.81% 2022 25.98% 2021 27.31% 2020 26.42% 2019 22.71% 2018 17.11% 2017 8.74% 2016 2.95% 2015 0.95% - Data Graph
-

Xiaomi’s current yearly market share is 20.70%, a 6.61% decrease from its peak of 27.31% in 2021. Even though its brand share declined, Xiaomi continued to dominate the Indian smartphone market as it remained on top among other smartphone brands since 2020, taking the highest spot from Samsung.
SAMSUNG
Samsung Market Share in India
Samsung currently ranks third in the Indian smartphone market, with a monthly market of 13.69%. It comes after Xiaomi and Vivo in first and second place, respectively.
It wasn’t only until January 2023 that Samsung slid to the third spot. Samsung used to hold second place in terms of market share in India since 2020. From 2014 to 2019, Samsung was the largest smartphone company in India in terms of market share.
Samsung led the affordable premium smartphone segment in the first quarter of 2022.
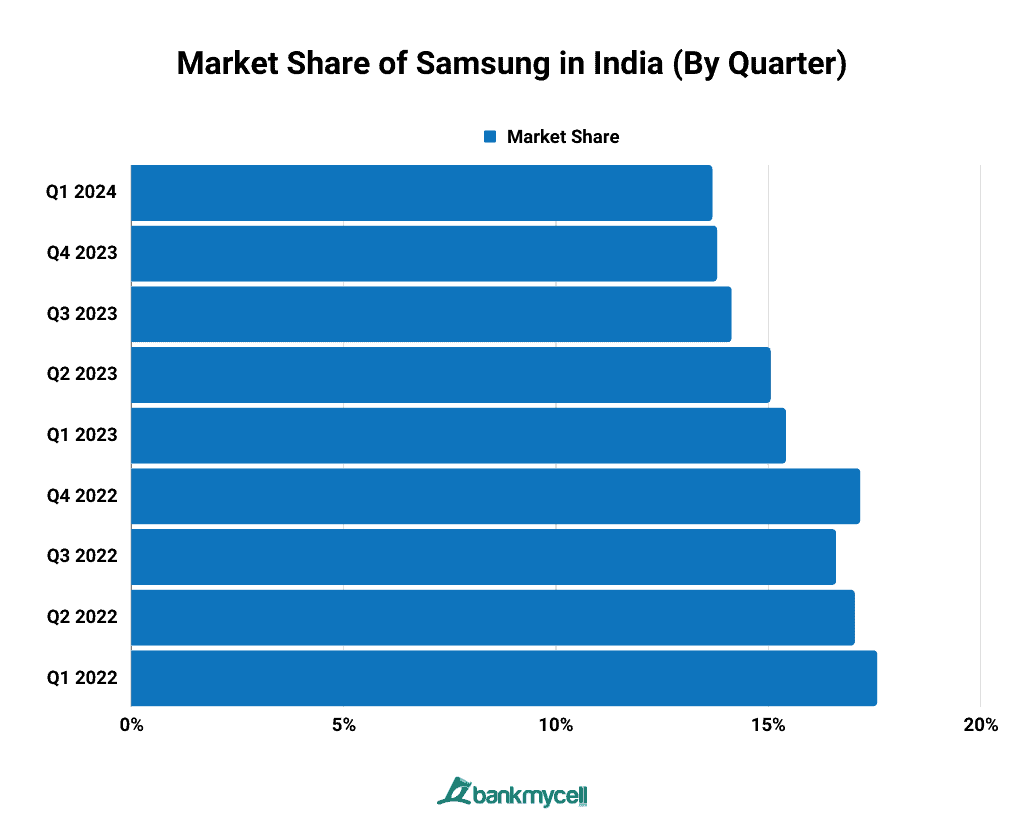
Market Share of Samsung in India (By Quarter)
| Quarter | Market Share |
|---|---|
| Q1 2024 | 13.69% |
| Q4 2023 | 13.80% |
| Q3 2023 | 14.14% |
| Q2 2023 | 15.06% |
| Q1 2023 | 15.42% |
| Q4 2022 | 17.17% |
| Q3 2022 | 16.60% |
| Q2 2022 | 17.04% |
| Q1 2022 | 17.57% |
- Data Table
-
Quarter Market Share Q1 2024 13.69% Q4 2023 13.80% Q3 2023 14.14% Q2 2023 15.06% Q1 2023 15.42% Q4 2022 17.17% Q3 2022 16.60% Q2 2022 17.04% Q1 2022 17.57% - Data Graph
-

Samsung’s Q1 2024 market share is 13.69%, a decrease of 0.11% from Q4 2023. Quarterly data show that the company peaked at 17.57% market share in the first quarter of 2022 and recorded the lowest in the first quarter of 2024. Nevertheless, the brand remains in the top three on the list of the biggest smartphone brands in the Indian market.
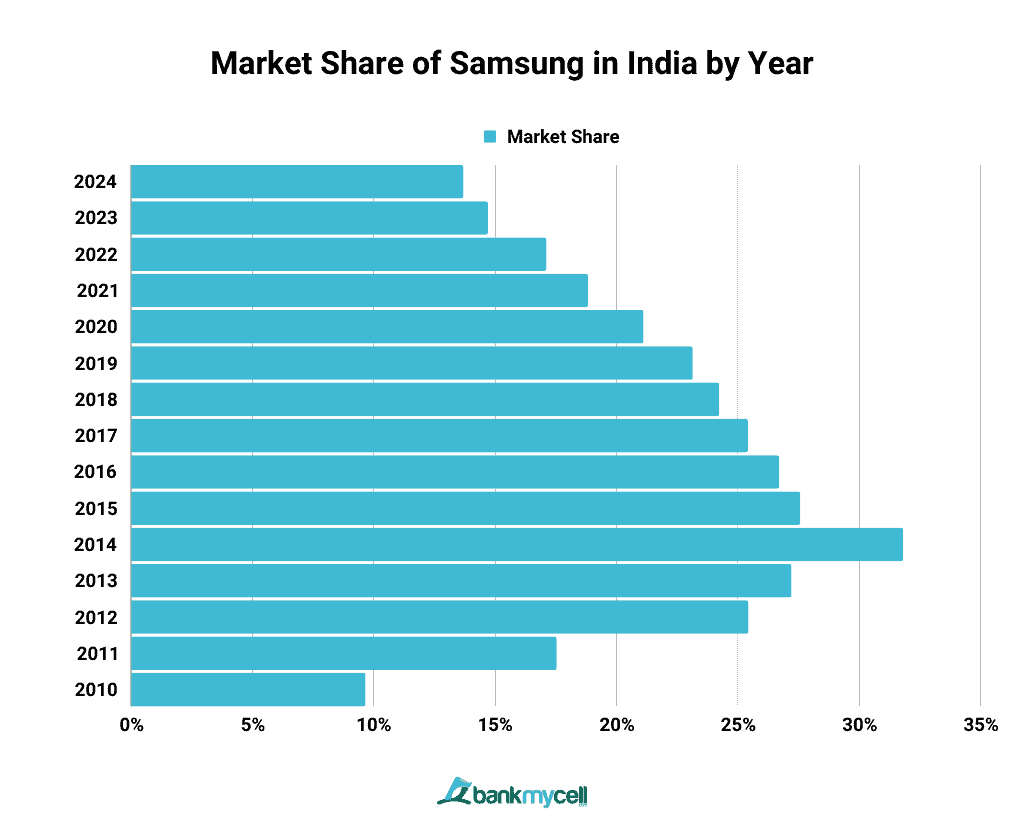
Market Share of Samsung in India by Year (2010-2024)
| Year | Market Share |
|---|---|
| 2024 | 13.69% |
| 2023 | 14.70% |
| 2022 | 17.11% |
| 2021 | 18.82% |
| 2020 | 21.11% |
| 2019 | 23.14% |
| 2018 | 24.23% |
| 2017 | 25.41% |
| 2016 | 26.70% |
| 2015 | 27.57% |
- Data Table
-
Year Market Share 2024 13.69% 2023 14.70% 2022 17.11% 2021 18.82% 2020 21.11% 2019 23.14% 2018 24.23% 2017 25.41% 2016 26.70% 2015 27.57% - Data Graph
-

Samsung’s most recent annual market share in the Indian smartphone market is 13.69%, a slight decline from 2023 of around 1.01%. The brand’s figures have significantly decreased in recent years. Samsung’s yearly market share peaked in 2014 at 31.81%, and the company took 20% or higher from 2012 to 2020. It only had 18.82% market share in 2021, however, and is continuously seeing a downward trend. It went from being the top vendor in the country in 2014 to the third rank in 2023.
VIVO
Vivo Market Share in India
Vivo is currently ranked second in India’s overall smartphone market, with an 18.22% monthly market share. It trails behind Xiaomi by 2.45% and is leading Samsung by 4.53%.
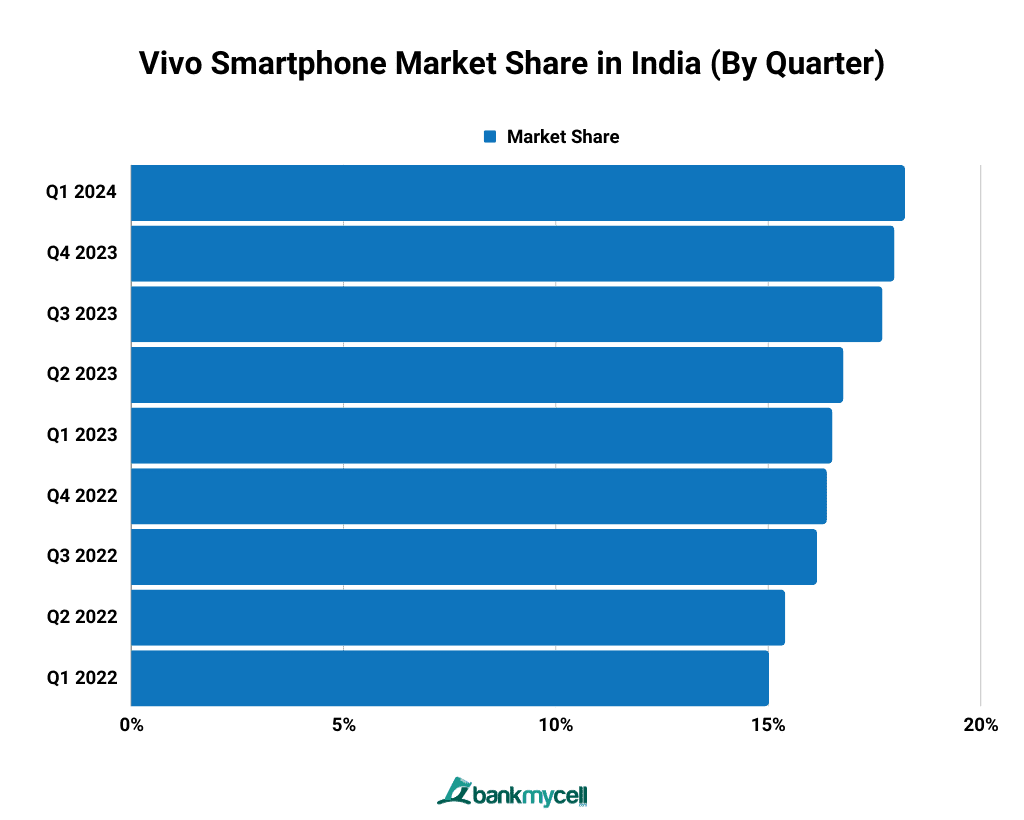
Vivo Smartphone Market Share in India (By Quarter)
| Quarter | Market Share |
|---|---|
| Q1 2024 | 18.22% |
| Q4 2023 | 17.97% |
| Q3 2023 | 17.69% |
| Q2 2023 | 16.77% |
| Q1 2023 | 16.51% |
| Q4 2022 | 16.38% |
| Q3 2022 | 16.15% |
| Q2 2022 | 15.40% |
| Q1 2022 | 15.02% |
- Data Table
-
Quarter Market Share Q1 2024 18.22% Q4 2023 17.97% Q3 2023 17.69% Q2 2023 16.77% Q1 2023 16.51% Q4 2022 16.38% Q3 2022 16.15% Q2 2022 15.40% Q1 2022 15.02% - Data Graph
-

Vivo’s quarterly market share in Q1 2024 is 18.22%, a 0.25% increase compared to Q4 2023. The brand has seen an upward trend in its most recent quarters and eventually unseated Samsung from the second position. Samsung held the second-largest market share in India from 2020 to 2022.
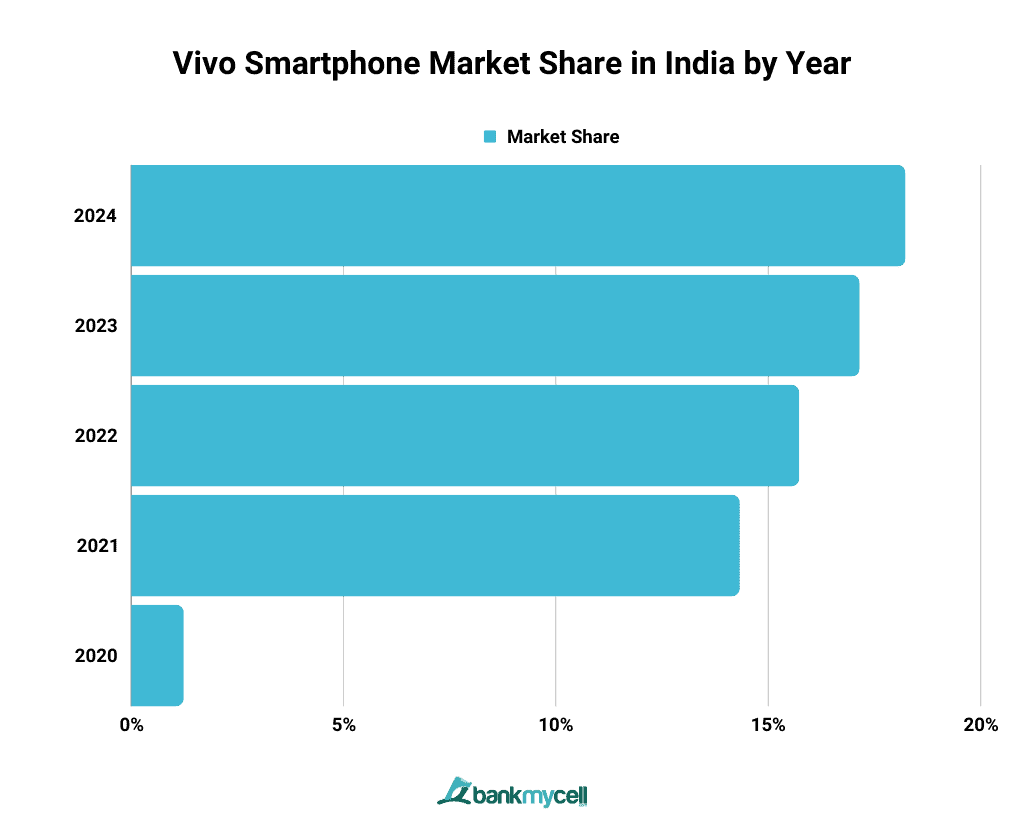
Vivo Smartphone Market Share in India by Year (2020-2024)
| Year | Market Share |
|---|---|
| 2024 | 18.23% |
| 2023 | 17.15% |
| 2022 | 15.73% |
| 2021 | 14.33% |
| 2020 | 1.24% |
- Data Table
-
Year Market Share 2024 18.23% 2023 17.15% 2022 15.73% 2021 14.33% 2020 1.24% - Data Graph
-

Vivo’s yearly market share in 2024 is 18.23%, an increase of 1.08% from the previous year. Vivo’s market penetration has shown significant growth in just a few years. In 2020, the company only had a 1.24% market share.
HUAWEI
Huawei Market Share in India
Huawei’s current brand share in the Indian smartphone market is 0.41%. It ranks 11th among the country’s top smartphone brands.
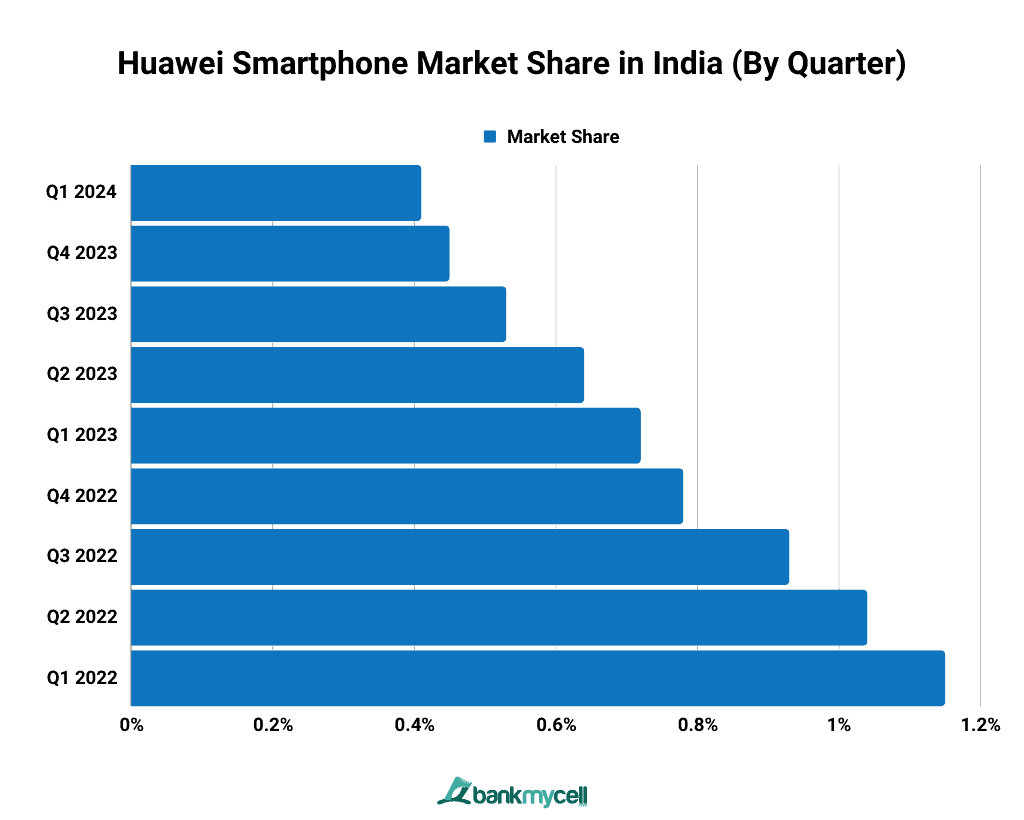
Huawei Smartphone Market Share in India (By Quarter)
| Quarter | Market Share |
|---|---|
| Q1 2024 | 0.41% |
| Q4 2023 | 0.45% |
| Q3 2023 | 0.53% |
| Q2 2023 | 0.64% |
| Q1 2023 | 0.72% |
| Q4 2022 | 0.78% |
| Q3 2022 | 0.93% |
| Q2 2022 | 1.04% |
| Q1 2022 | 1.15% |
- Data Table
-
Quarter Market Share Q1 2024 0.41% Q4 2023 0.45% Q3 2023 0.53% Q2 2023 0.64% Q1 2023 0.72% Q4 2022 0.78% Q3 2022 0.93% Q2 2022 1.04% Q1 2022 1.15% - Data Graph
-

Huawei’s most recent quarterly market share in India is at 0.41%, placing it among the top 11 manufacturers in the country. Compared to the fourth quarter of 2023, the brand’s market share decreased by 0.04%. Huawei has seen a downward trend in brand share in the most recent quarters.
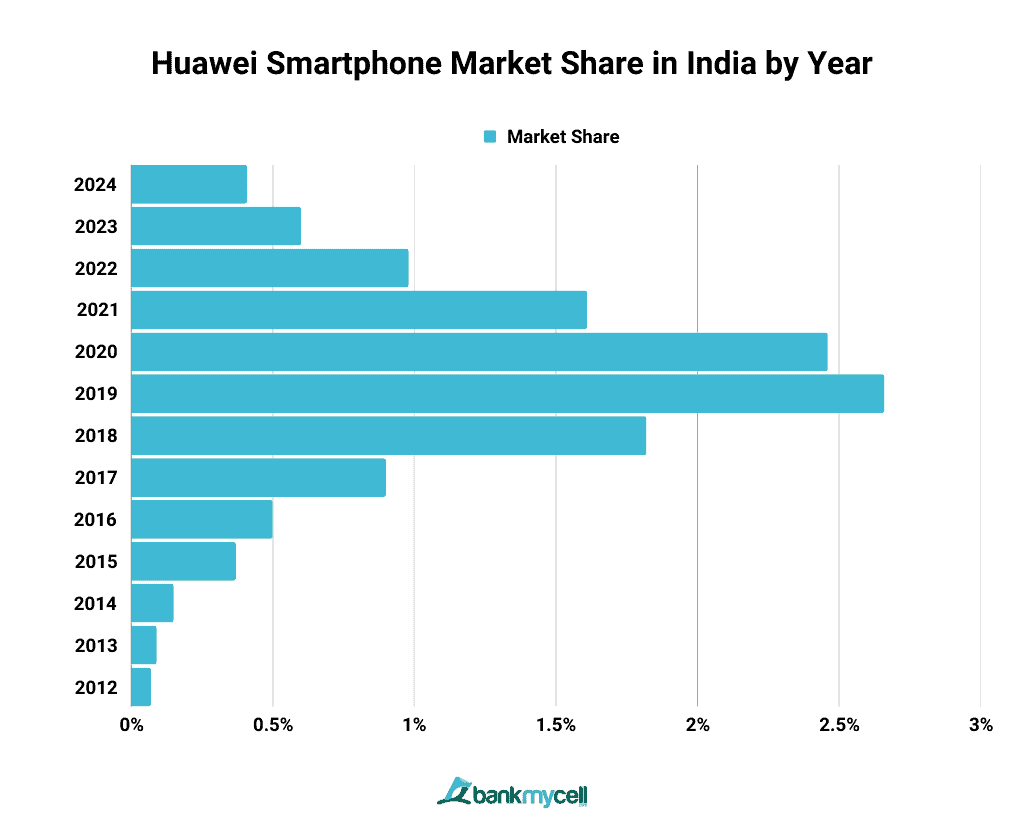
Huawei Smartphone Market Share in India by Year (2012-2024)
| Year | Market Share |
|---|---|
| 2024 | 0.41% |
| 2023 | 0.60% |
| 2022 | 0.98% |
| 2021 | 1.61% |
| 2020 | 2.46% |
| 2019 | 2.66% |
| 2018 | 1.82% |
| 2017 | 0.90% |
| 2016 | 0.50% |
| 2015 | 0.37% |
| 2014 | 0.15% |
| 2013 | 0.09% |
| 2012 | 0.07% |
- Data Table
-
Year Market Share 2024 0.41% 2023 0.60% 2022 0.98% 2021 1.61% 2020 2.46% 2019 2.66% 2018 1.82% 2017 0.90% 2016 0.50% 2015 0.37% 2014 0.15% 2013 0.09% 2012 0.07% - Data Graph
-

Huawei ranks 11th in the India smartphone market, with a current annual market share of 0.41%, a 0.19% decrease from 2023, and the company’s lowest since 2017. The brand’s yearly market share peaked in 2019 at 2.66%.
OPPO
OPPO Market Share in India
OPPO is in the fifth position among India’s most popular smartphone vendors, with a monthly market share of 11.71%. This is a 0.48% increase compared to the brand’s peak monthly market share in 2023 at 12.19%.
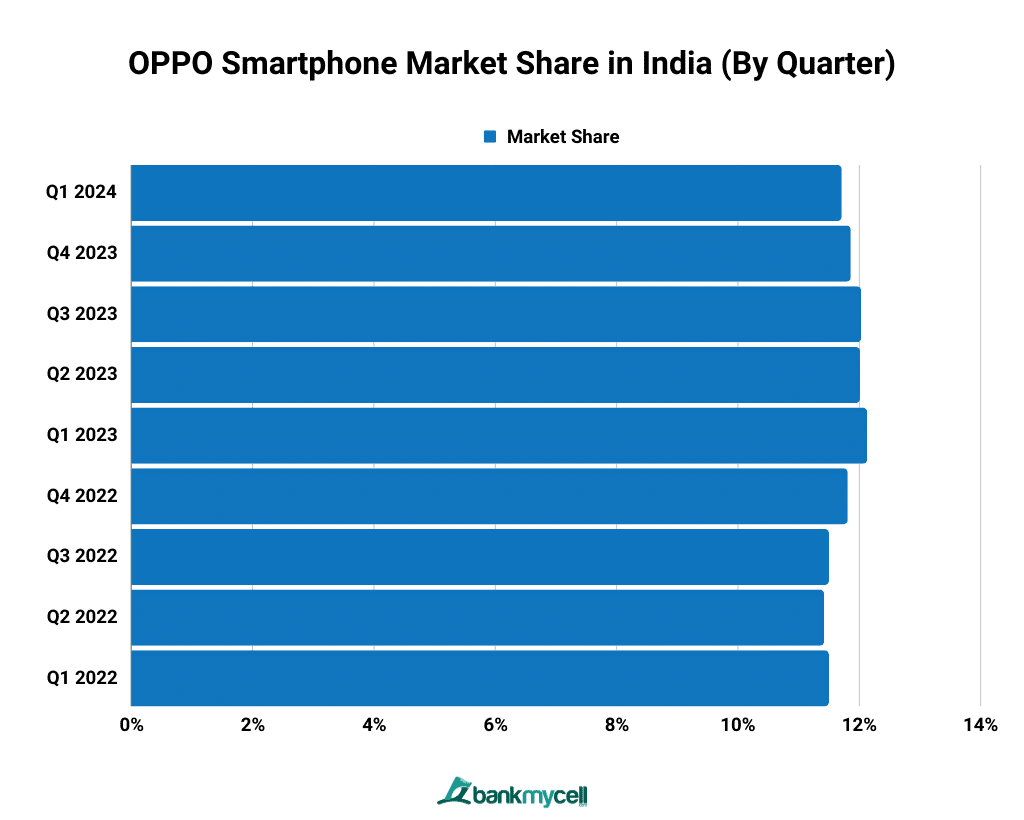
OPPO Smartphone Market Share in India (By Quarter)
| Quarter | Market Share |
|---|---|
| Q1 2024 | 11.71% |
| Q4 2023 | 11.86% |
| Q3 2023 | 12.03% |
| Q2 2023 | 12.01% |
| Q1 2023 | 12.13% |
| Q4 2022 | 11.81% |
| Q3 2022 | 11.50% |
| Q2 2022 | 11.42% |
| Q1 2022 | 11.50% |
- Data Table
-
Quarter Market Share Q1 2024 11.71% Q4 2023 11.86% Q3 2023 12.03% Q2 2023 12.01% Q1 2023 12.13% Q4 2022 11.81% Q3 2022 11.50% Q2 2022 11.42% Q1 2022 11.50% - Data Graph
-

OPPO is included in the top five brands in the India smartphone market in Q1 2024, with a quarterly brand share of 11.71%. Its market share declined by 0.15% compared to Q4 2023.
According to Counterpoint Research, OPPO grew 12% year-on-year in the third quarter of 2019 due to consumer demand for their A5s, their budget segment device, and their F11 series, which is considered to have reliable performance.
OPPO Smartphone Market Share in India by Year (2010-2024)
| Year | Market Share |
|---|---|
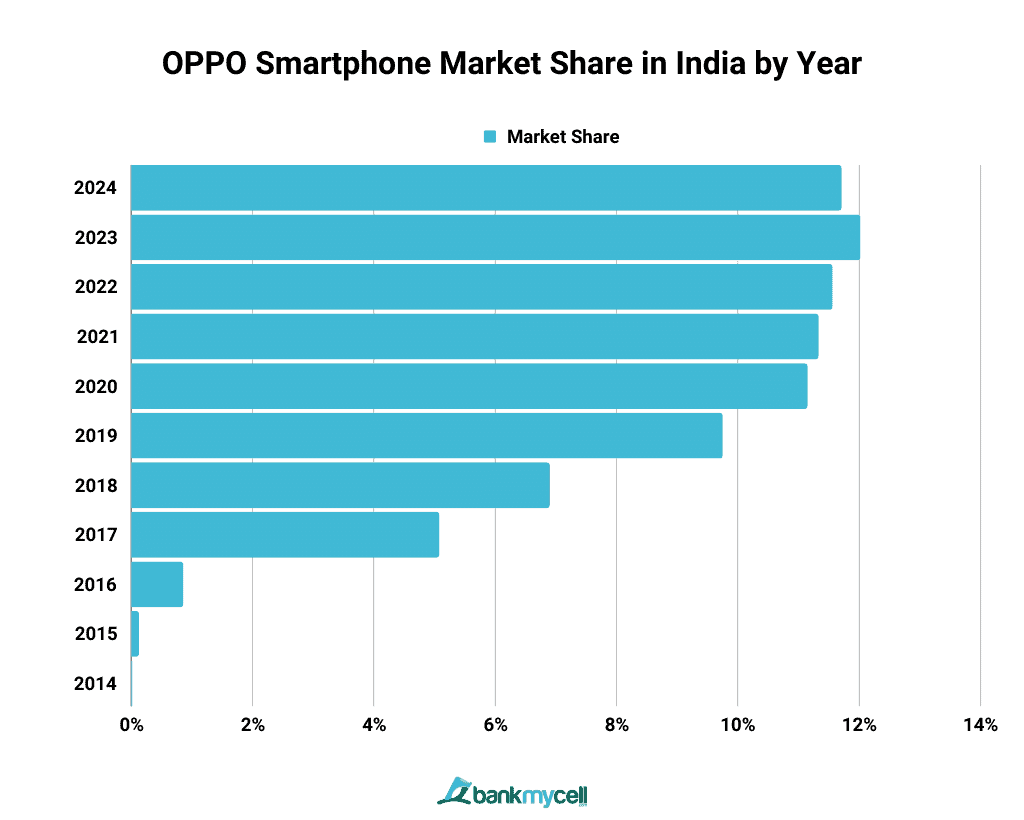
| 2024 | 11.71% |
| 2023 | 12.02% |
| 2022 | 11.56% |
| 2021 | 11.33% |
| 2020 | 11.15% |
| 2019 | 9.75% |
| 2018 | 6.90% |
| 2017 | 5.08% |
| 2016 | 0.86% |
| 2015 | 0.13% |
| 2014 | 0.02% |
- Data Table
-
Year Market Share 2024 11.71% 2023 12.02% 2022 11.56% 2021 11.33% 2020 11.15% 2019 9.75% 2018 6.90% 2017 5.08% 2016 0.86% 2015 0.13% 2014 0.02% - Data Graph
-

Oppo recorded a yearly market share of 11.71% in 2024, a decline of 0.31% from the previous year. 2023 was the highest market share for the brand thus far. The brand has shown steady and consistent growth since 2014.
APPLE
Apple Market Share in India
I am text block. Click edit button to change this text. Lorem ipsum dolor sit amet, consectetur adipiscing elit. Ut elit tellus, luctus nec ullamcorper mattis, pulvinar dapibus leo.
Apple has a 4.10% monthly market share in the Indian smartphone market, putting it among the top seven smartphone vendors in the country. Despite being one of the leading smartphone brands globally, Apple hasn’t quite managed to breach a 5% market share in the Indian market.
Apple Smartphone Market Share in India (By Quarter)
| Quarter | Market Share |
|---|---|
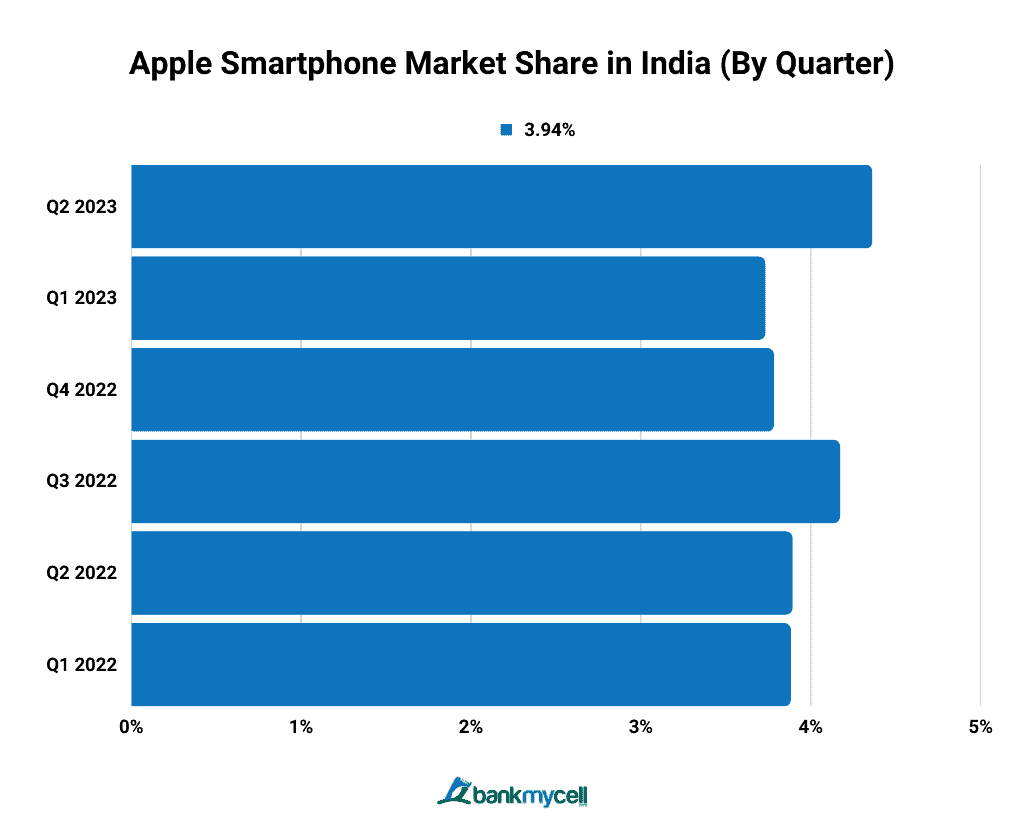
| Q1 2024 | 4.10% |
| Q4 2023 | 3.94% |
| Q3 2023 | 3.94% |
| Q2 2023 | 4.36% |
| Q1 2023 | 3.73% |
| Q4 2022 | 3.78% |
| Q3 2022 | 4.17% |
| Q2 2022 | 3.89% |
| Q1 2022 | 3.88% |
- Data Table
-
Quarter Market Share Q1 2024 4.10% Q4 2023 3.94% Q3 2023 3.94% Q2 2023 4.36% Q1 2023 3.73% Q4 2022 3.78% Q3 2022 4.17% Q2 2022 3.89% Q1 2022 3.88% - Data Graph
-

Apple’s quarterly market share in India in Q1 2024 is 4.10%, a 0.16% increase from the fourth quarter of 2023. Apple’s quarterly brand share in 2022 peaked in the second quarter at 4.36%
Apple led the premium smartphone segment (at more than 30,000 Indian rupees) in the first quarter of 2022, followed by Samsung.
Apple Smartphone Market Share in India by Year (2010-2024)
| Year | Market Share |
|---|---|
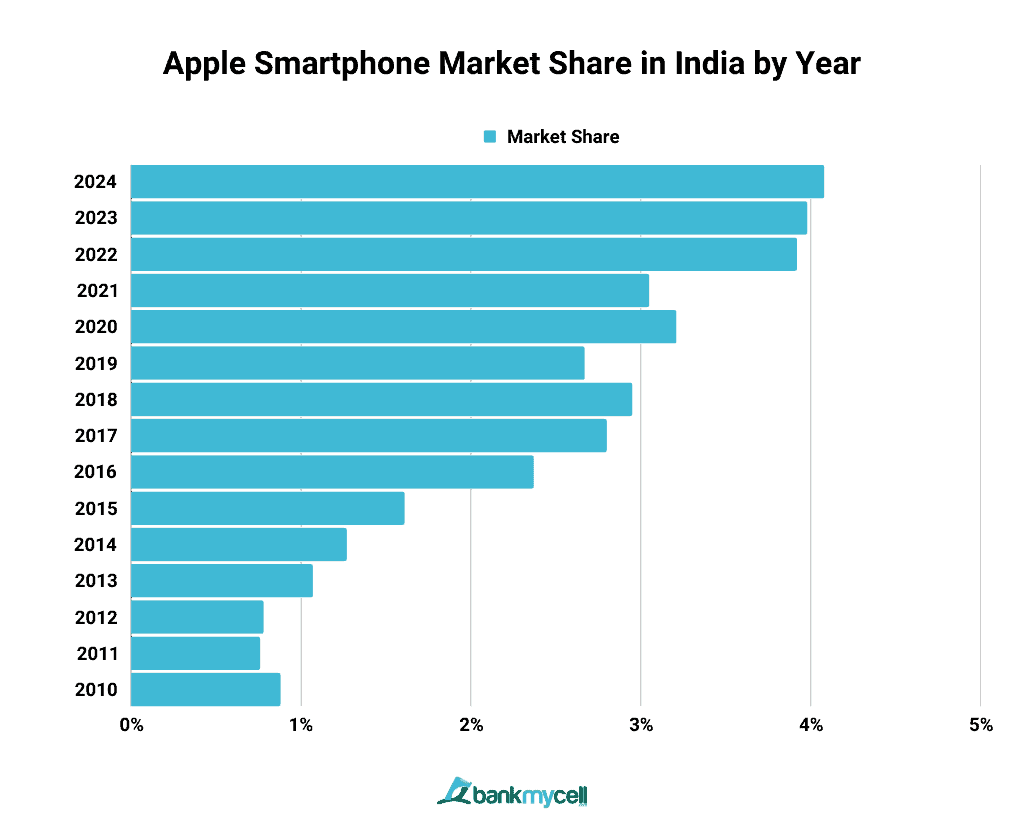
| 2024 | 4.08% |
| 2023 | 3.98% |
| 2022 | 3.92% |
| 2021 | 3.05% |
| 2020 | 3.21% |
| 2019 | 2.67% |
| 2018 | 2.95% |
| 2017 | 2.80% |
| 2016 | 2.37% |
| 2015 | 1.61% |
| 2014 | 1.27% |
| 2013 | 1.07% |
| 2012 | 0.78% |
| 2011 | 0.76% |
| 2010 | 0.88% |
- Data Table
-
Year Market Share 2024 4.08% 2023 3.98% 2022 3.92% 2021 3.05% 2020 3.21% 2019 2.67% 2018 2.95% 2017 2.80% 2016 2.37% 2015 1.61% 2014 1.27% 2013 1.07% 2012 0.78% 2011 0.76% 2010 0.88% - Data Graph
-

Apple had a market share of 4.08% in 2024, an increase of 0.01% from 2023. The brand had the highest yearly market share this year. Despite taking almost 30% smartphone market share worldwide, Apple has never reached more than 5% yearly market share in India.